DUET
Introduction
DUET’s use of Digital Twins truly changes the policy game, disrupting the field of Smart Cities and transitioning to a new age of Responsive Cities. With Responsive Cities, solutions are not designed around citizens, they are designed with citizens.
Predictive simulations create a better understanding of how a service can meet the needs of its target audience, enabling differing teams from across an organisation to work together to make more informed choices.
To make DUET’s vision statement easy to understand and coalesce around, it has
-
(a) been broken down into three core project focus areas, and
-
(b) been condensed into one simple to understand sentence for each of those areas.
be set-up in one-click for systemic policy impact exploration and experimentation.
DUET’s visualisation client
The Visualisation client based on VC Map (provided by VCS) can be used from any computer or workstation with a modern browser which enables the execution of JavaScript and WebGL. WebGL is an API for rendering 3D computer graphics within a browser without the use of plug-ins. It has been activated in all modern browsers since 2011. Internet Explorer is not supported anymore. Microsoft Edge supports WebGL from version 0.95. The DUET visualisation client is developed as a plugin for VC Map (provided by VCS) and thus has high dependencies on that. The last used version in DUET of the VC Map is v4.2.9 build #618a3ea81. Future versions of the VC Map and VC Core will be open source and can be found here: VC Map and VC Core
VC Map is a JavaScript framework and API VC Map for building dynamic and interactive maps on the web. It can display 2D data, oblique imagery and massive 3D data including terrain data, vector data, mesh models, and point clouds making it easy for users to explore and interact with the data in an integrated and high-performance map application. VC Map apps can be rendered in all modern web browsers and on both desktop and mobile devices, bringing the map to where the user is. VC Map is built upon open, proven, and reliable GIS and web technologies such as OpenLayers and Cesium for the visualisation of 2D and 3D geo-data. It can load and display data from various sources and in different formats including open OGC standards and interfaces. Users can easily switch between the 2D, oblique and 3D views and dynamically add map layers to the scene that are accessible in all views. The VC Map framework offers ready-to-use map tools and widgets that can be flexibly combined in a VC Map app to meet the needs and demands of end-users and the target audience. Examples are navigation controls, map layers and legends, drawing and editing tools, split screens, camera flights, and GIS tools such as measurements, height profiles, viewshed analysis, or real-time shadows. VC Map provides a strong programming API for developers that makes it easy to build customised VC Map applications, to integrate VC Maps into any web page and to extend its functionalities with its own plugins. The VC Map framework and API is structured into the following four main architectural layers:
| Good to know DUET’s visualisation client is developed as Plugin for VC Map using the above mentioned Plugin API. Thus the existing visualisation client is bound to the provided VC Map version. |
Working with DUET viewer
DUET viewer functionalities dependending on user roles
The DUET viewer can be used by two major user groups with different functionality:
| functionality | unregistered users | registered users |
|---|---|---|
view or load a specific case |
||
view or load any case |
||
view or load a specific scenario from case |
||
view or load any scenario from any case |
||
create / view comments |
||
change current view (acc. to shown data) |
||
load data |
||
create / update cases |
||
create / update scenarios |
||
create / update scenarios |
||
run simulations |
As the figures above show, unregistered users are able to access cases and scenarios (as prepared), but are not able to add more data or to change the view, since they do not have access to DUET’s catalog, case or scenario manager. Registered users however are able to change the current view according to their needs, as Table 1 shows.
Adding data
-
Click on one of the POI’s to directly jump to a position in one of the Pilot regions
-
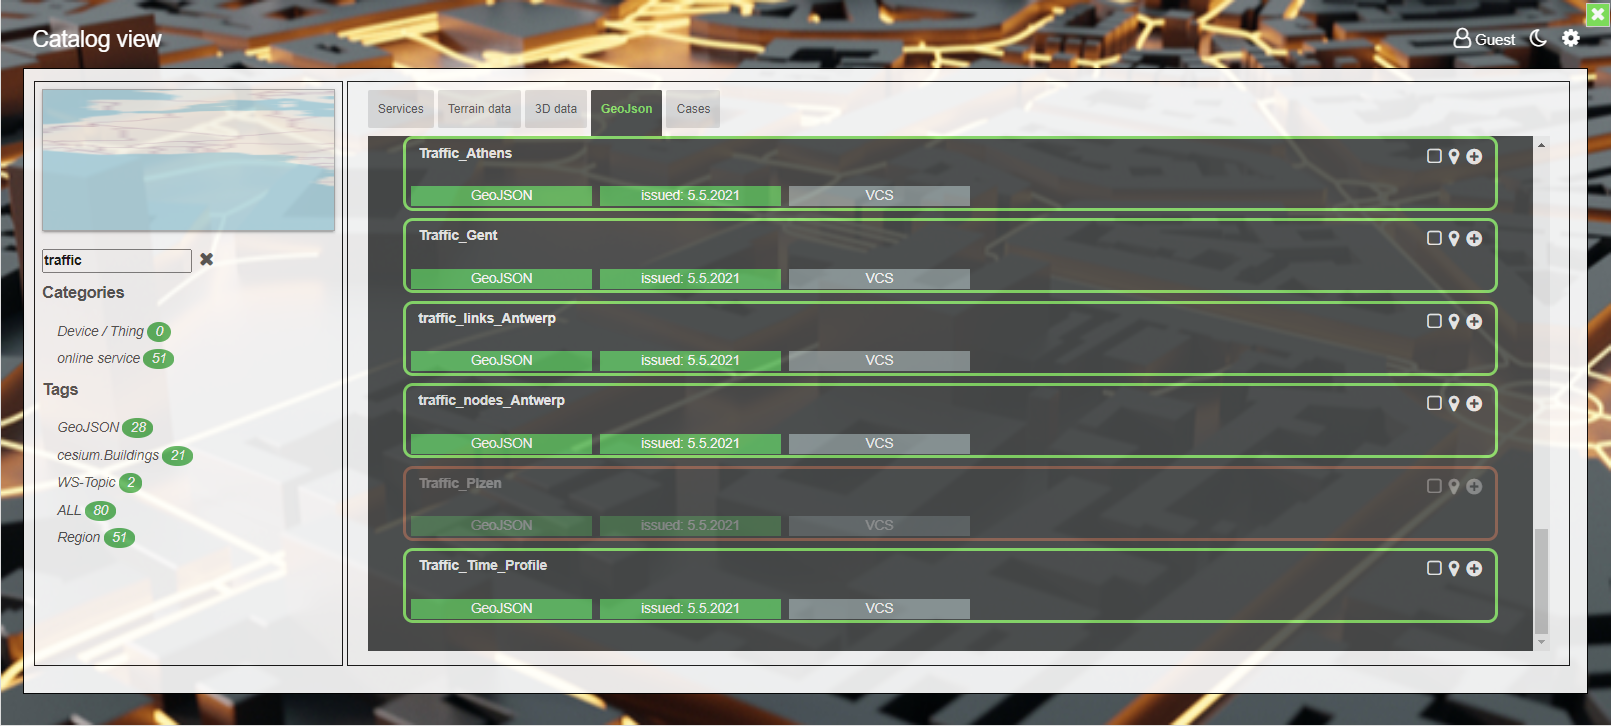
click on “Data” to open the Duet data catalog
Doing 1 at first will enforce the viewer to jump to a certain location. The current view point + 20km circumference will be used to filter the data of the catalog against your position. Thus on start-up of the data catalog only datasets with respect to your region will be shown.
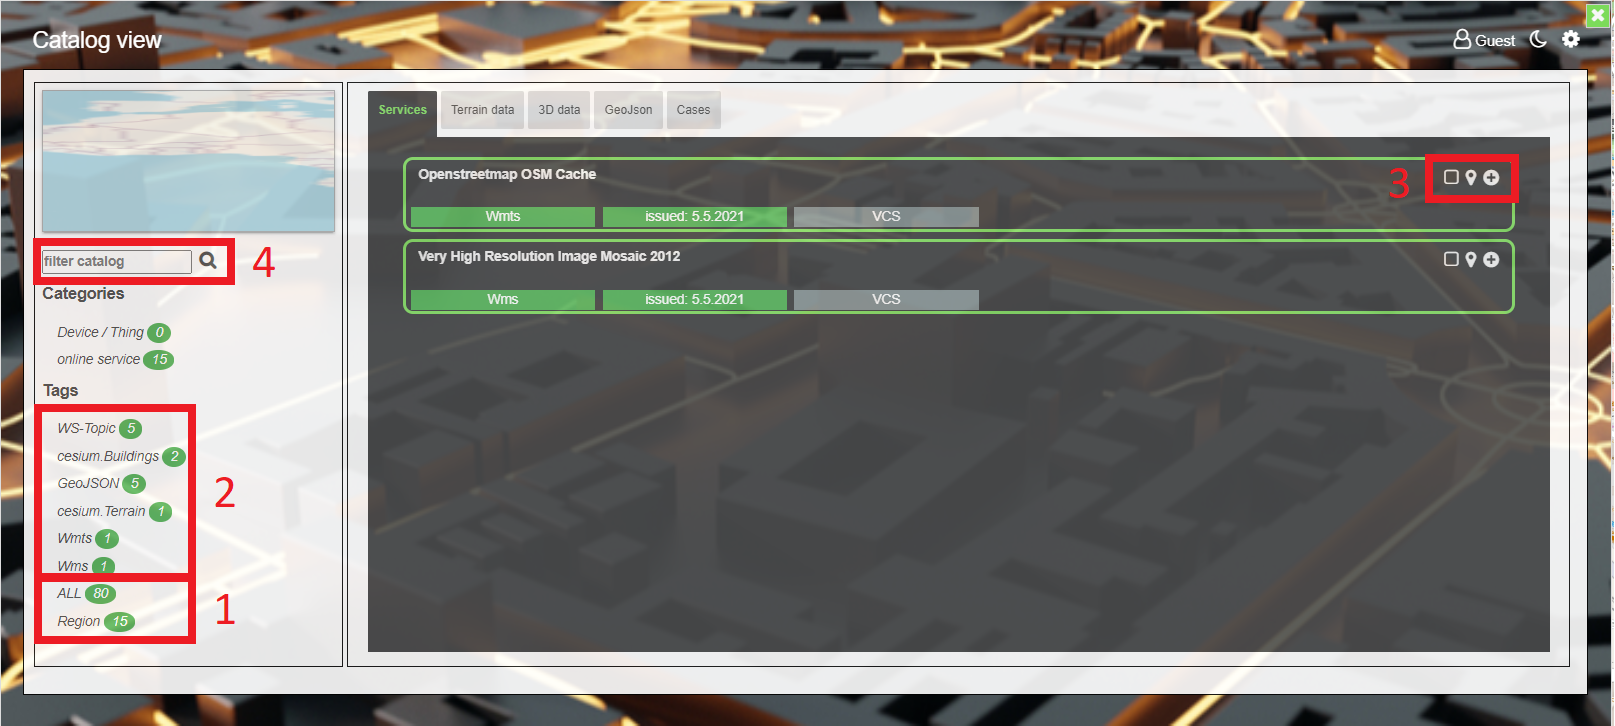
-
The tags in 1 will show you the number of datasets at all or in the current region. Clicking on one of the tags enables a switch between Regional and Total datasets.
-
The tags in 2 indicate what kind of datasets are available with respect to the chosen option of 1.
-
The symbols in 3 provide functionality to the user, as specified below (from left to right)
-
shows the extent of the dataset in the overview map on the left hand side
-
jumps to the center point of the dataset in main map view
-
adds the dataset to the map content
-
-
typing a word (place, type or part of dataset) searches the data catalog against that word and will provide the datasets fulfilling the search parameter inside the respective datatype tabs. Thus the search phrase “air” will bring up 5 datasets for example. However the search function is developed for the whole data catalog and provides a full list of datasets fulfilling the search parameter. The results are not bound to the current region.
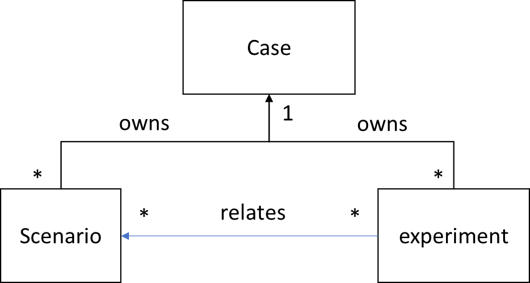
Role of cases, scenarios and experiments in DUET
Within the Duet visualisation client we differentiate between cases, scenarios and experiments. The role of cases, scenarios and experiments are described here from a visualisation point of view. Dedicated especially for users and administration purposes to be able to present a Digital Twin model with a specific purpose.
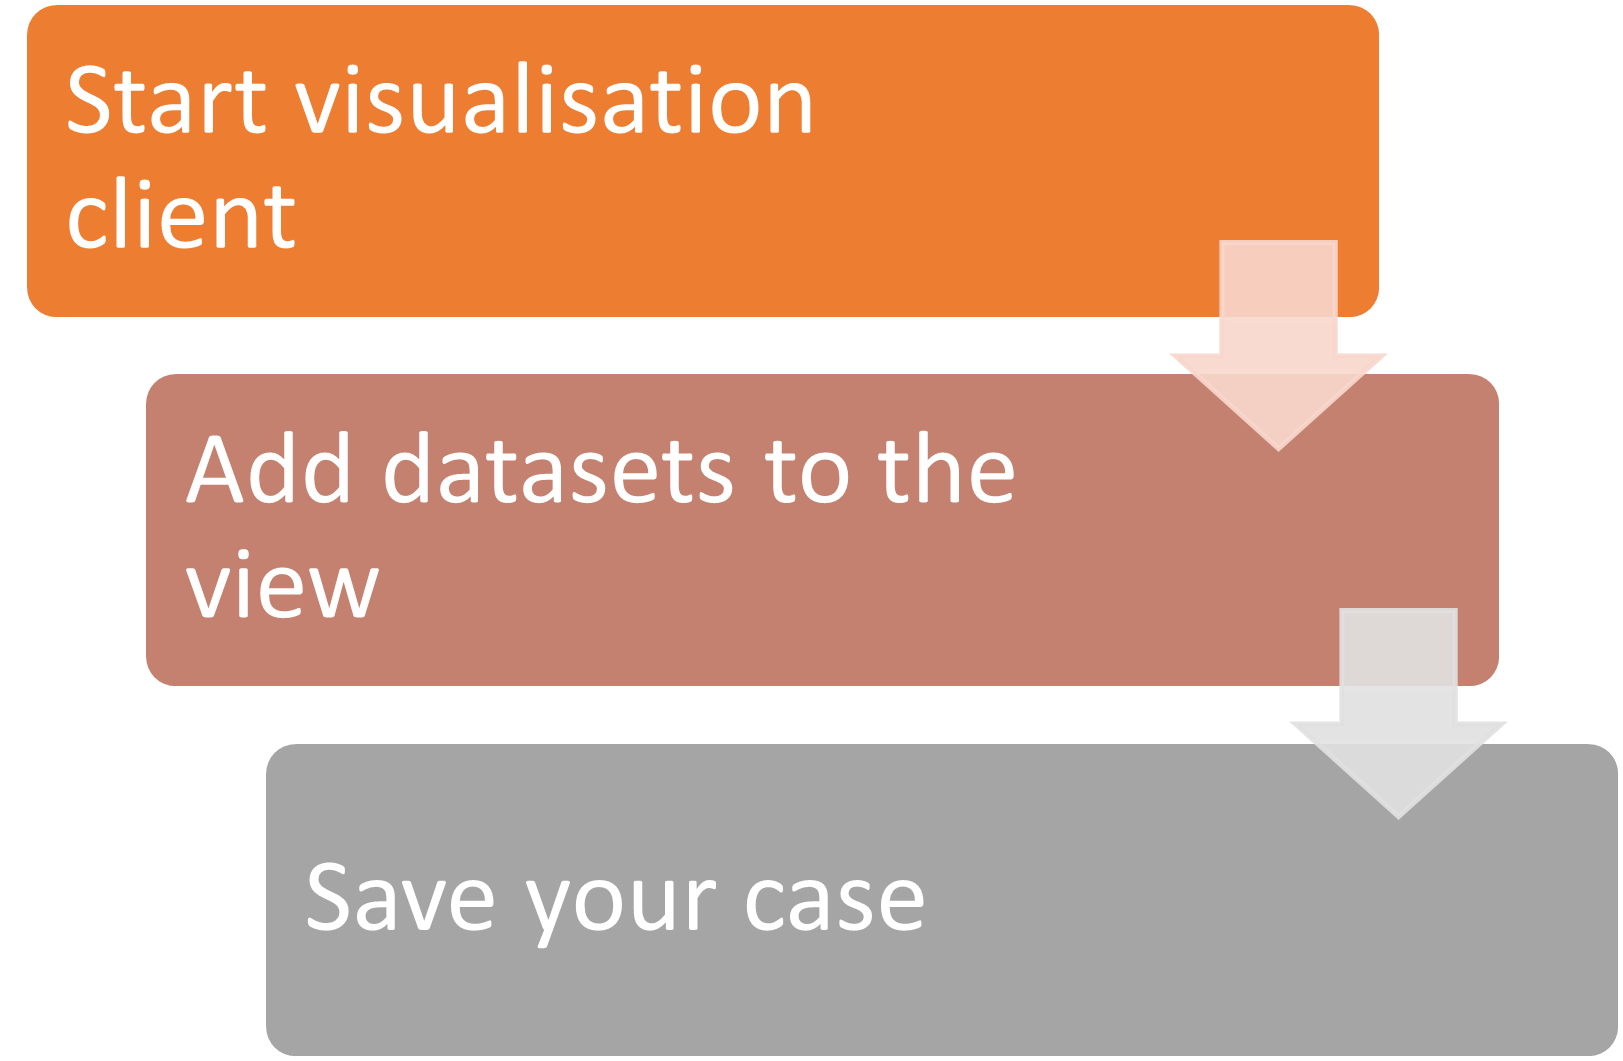
Create a new case
-
At first the User with respective DUET role (NON-GUESTS) starts the client empty.
-
Afterwards the user selects the datasets fitting to his case challenge from data view and thus adds them to the visualisation client.
-
Then the user can save the case / scenario and thus registers the settings in the respective manager api. In case of saving a case the base is set for saving experiments, later on.
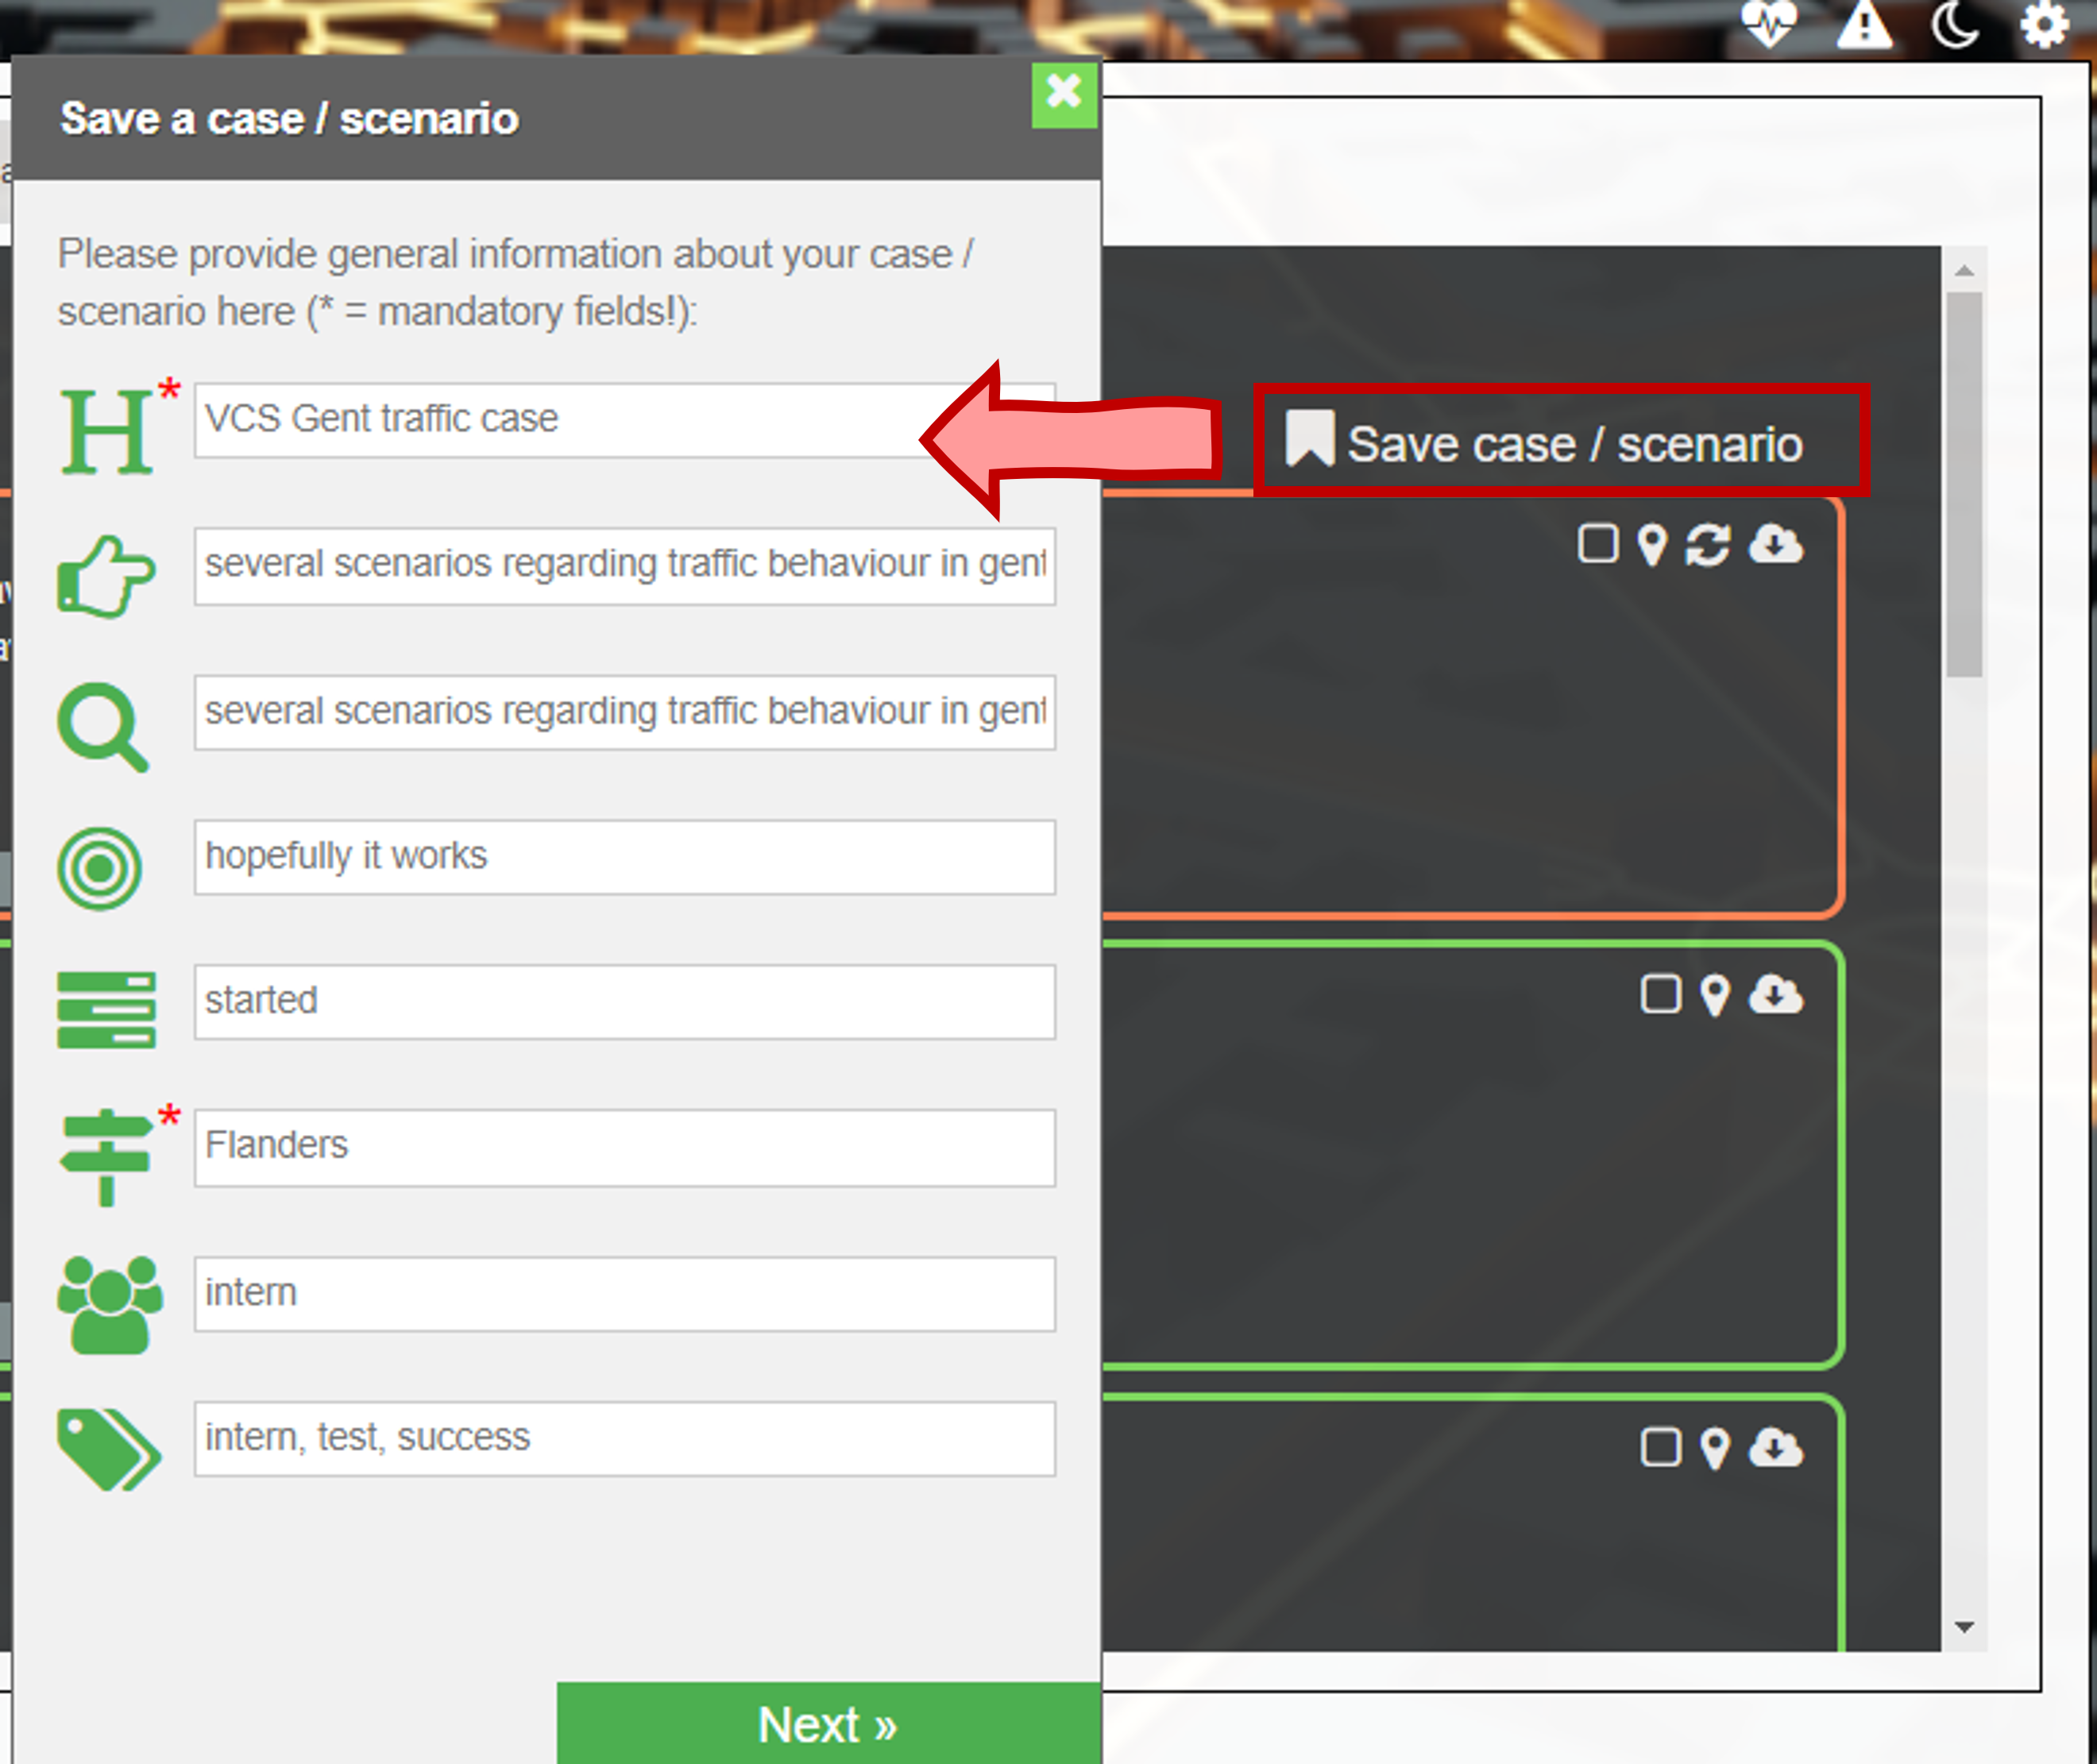
The whole process is arranged as a kind of wizard, where the user has to set several titles, settings in order to save or update either a case or scenario. By opening the case tab in the data view the user can open the wizard by clicking on “Save case / scenario”, as it is shown to the left. A floating component appears starting with some initial descriptions of the case / scenario. If a case / scenario is already loaded the fields are filled with values given by the case or the scenario. Thus the user can either leave them as they are or update them. The main idea of a case creation is described in Case.
At least three fields are required to be filled out by the user, marked with an red asterisk.
-
Title - giving a scenario or case a title element
-
Approach - a description of the case / scenario approach to distinguish that case / scenarion from others
-
Pilot - a region field to relate the case / scenario to a specific DUET pilot region
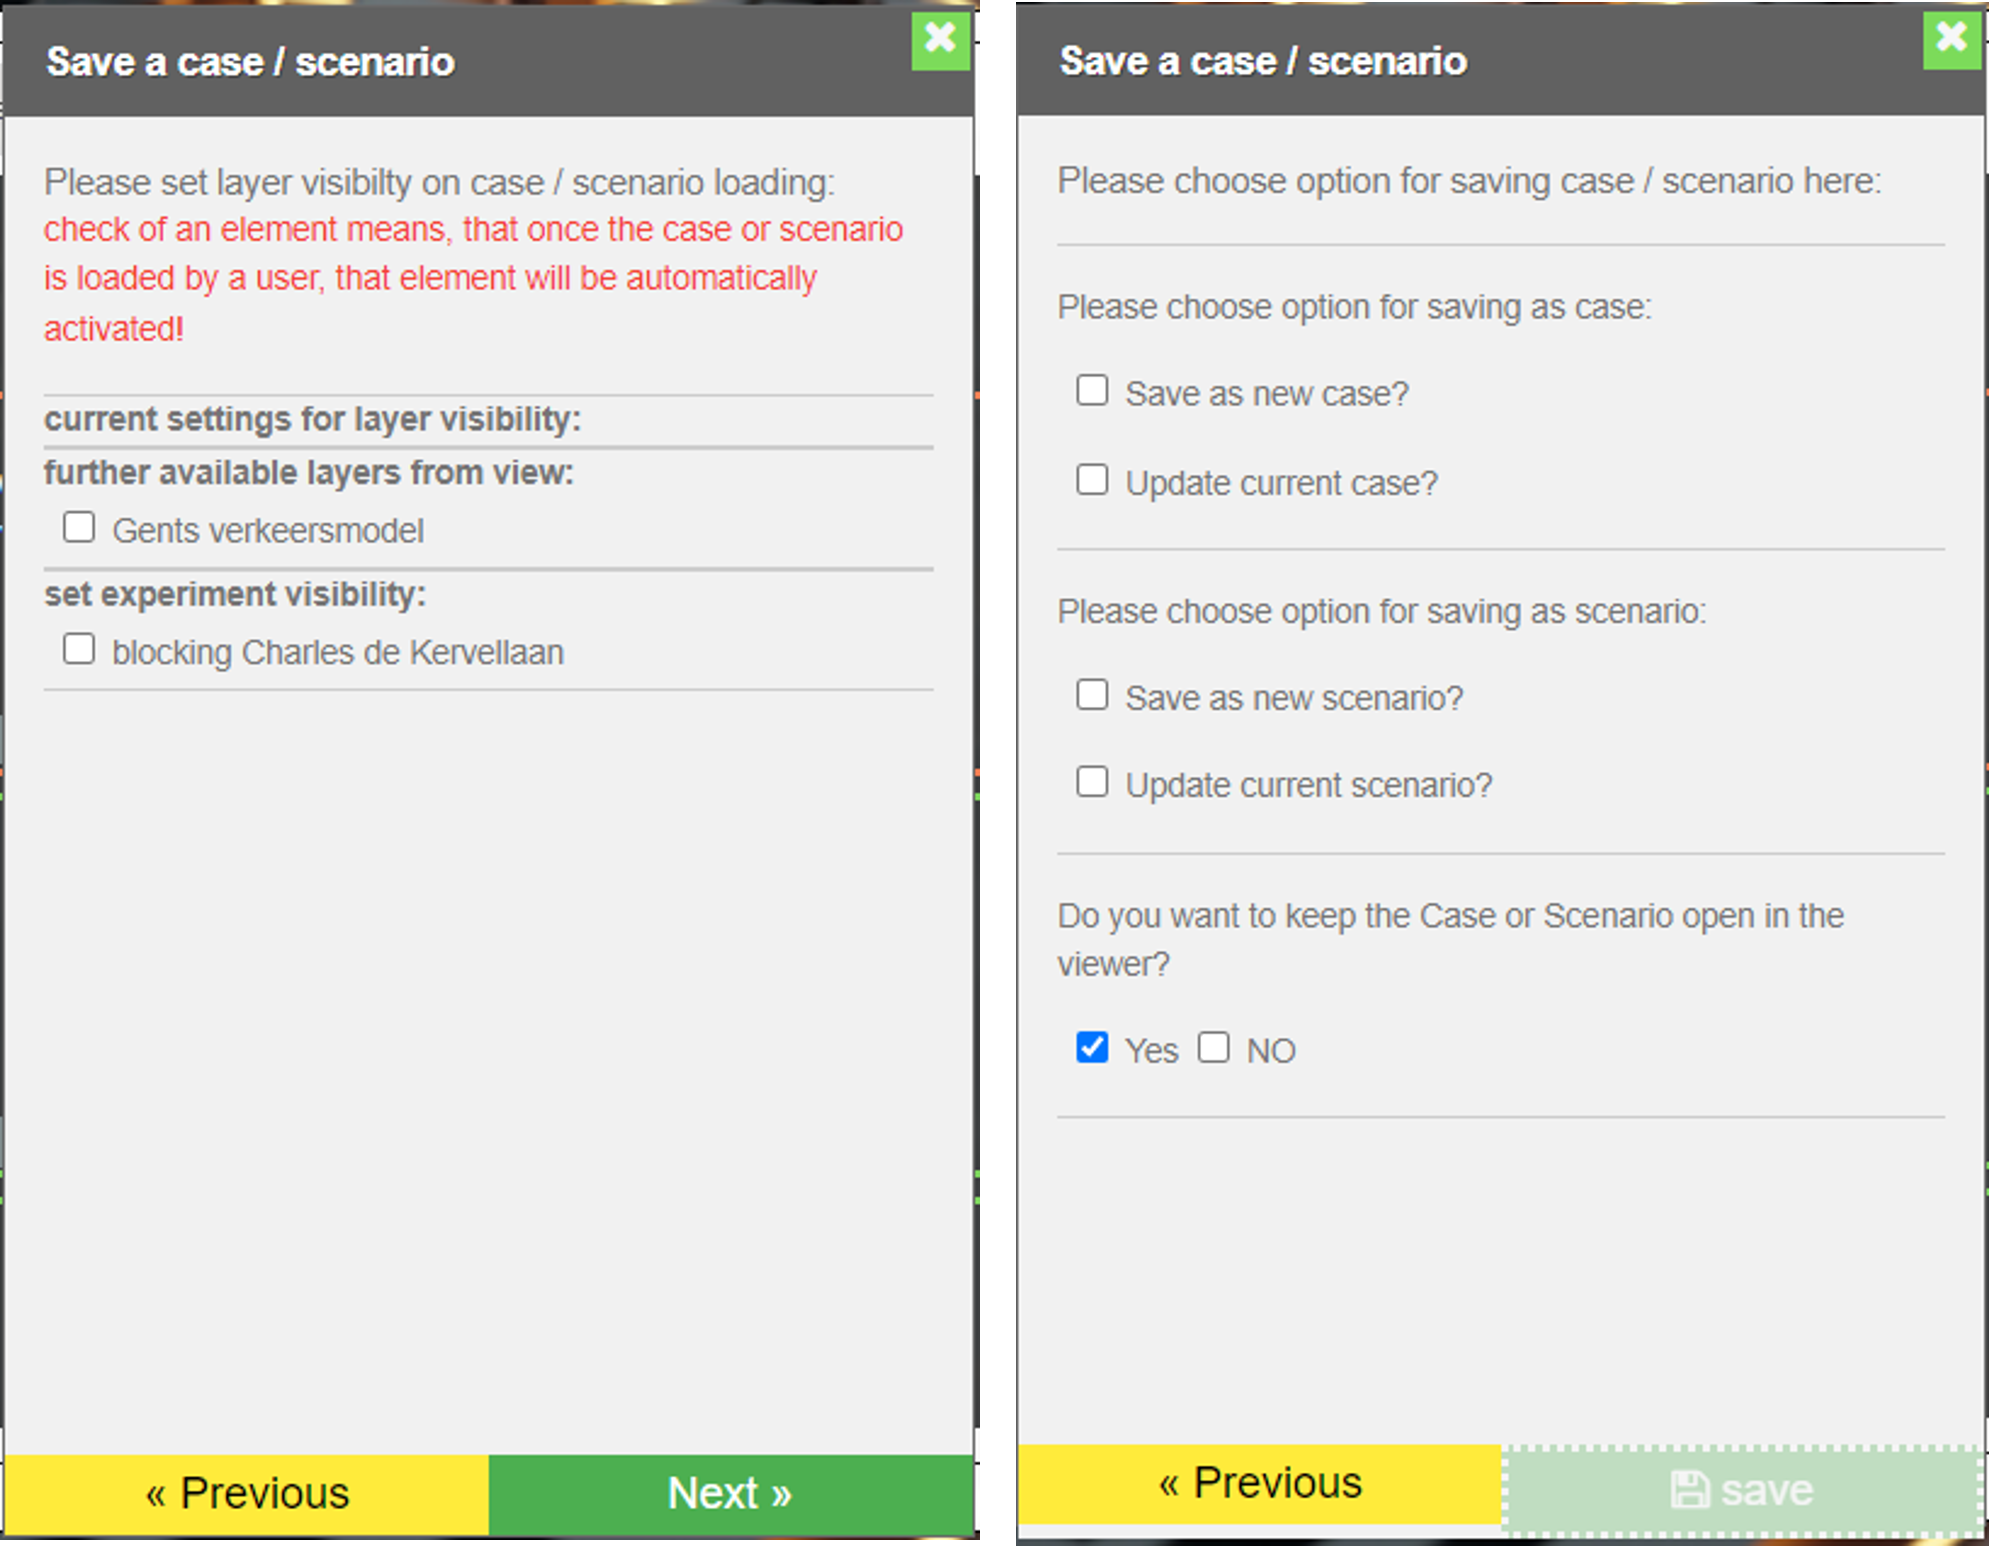
The left one shows settings for layer visibility. Means the user can set specific layers to be activated directly on caseload and others to be loaded, but not set to be visible on start. The right one shows the last dialog of that wizard where the user is able to:
-
save the current view and settings as new case
-
use the current view and settings to update the already loaded case
-
save the current view and settings as new scenario
-
use the current view and settings to update the already loaded scenario
If one of the above choices are enabled, the user is able to save and depending on that choice the settings will be sent to the case manager api or the scenario manager api.
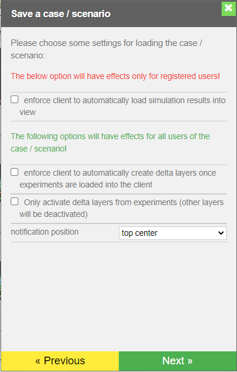
Besides that, the user is able to define via the wizard how the client should behave on case / scenario load and during the work inside the case / scenario. The option to automatically load simulation results into the viewer affects only NON-GUEST users, which are able to trigger simulations / model runs. The last two options are valid for all users. Here settings can be made to automatically create the delta layers and the visibility of them. See section Delta creation & visualisation for more information.
The main idea behind the case / scenario wizard is to define the behaviour and appearance of the viewer once a case or scenario is reopened by either another expert or non-expert user, such as a citizen.
Create a new scenario
The general scenario creation process is the same, as explained in Case. The major difference is, a case must be already loaded in the viewer to be able to create a new scenario in it, since a scenario is related to the parent case as explained here Role of cases, scenarios and experiments in DUET and here A visualisation scenario aka Scenario.
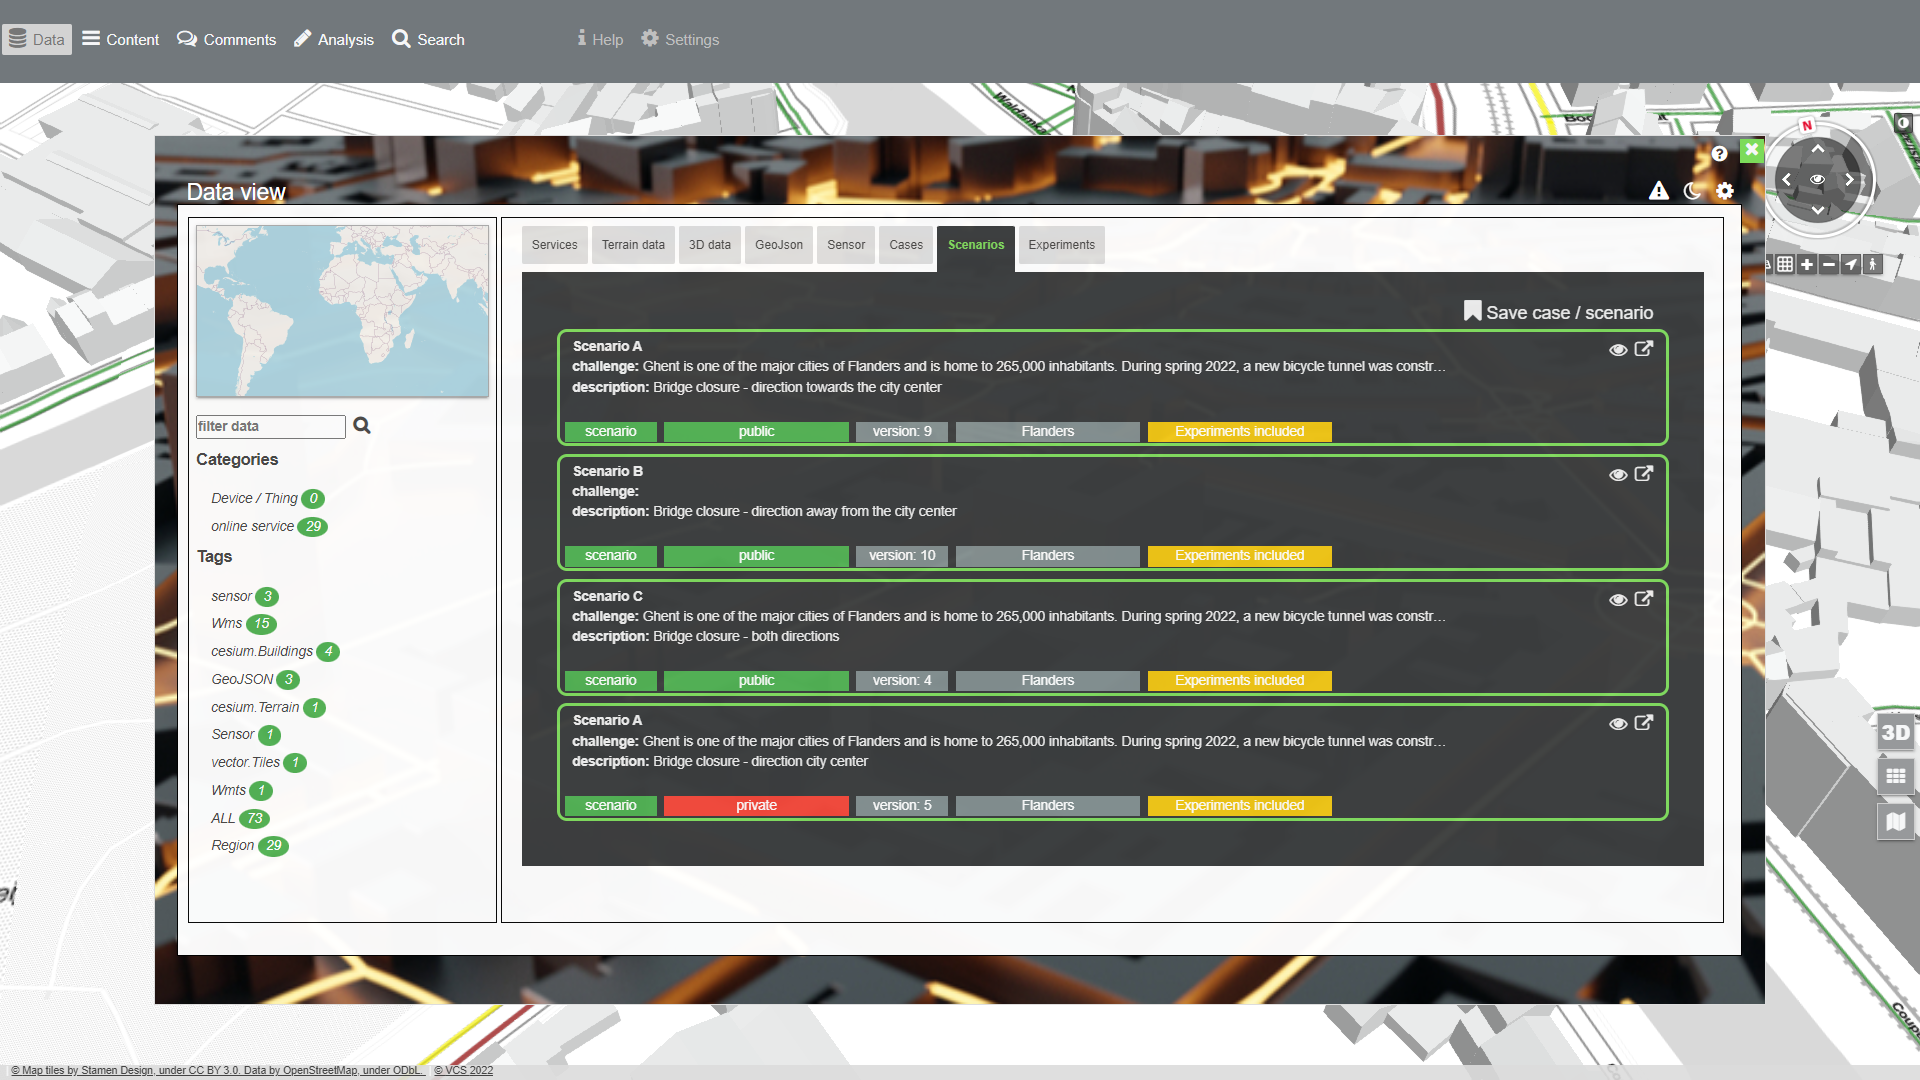
After the user has setup its scenario in the viewer, by adding experiments, the needed datasources, styles etc. He / she can enter the "Save case / Scenario" wizard (see: Figure 7) and can in the end choose (see: Figure 8, right image) to either save it as a new /update case or new /update scenario.
By creating a new scenario or by updating an existing scenario the user will have the possibility to set the scenario to be private or public.
|
private - means only registered users will be able to view this scenario public - means all users being able to enter the parent case will be able to view this scenario |
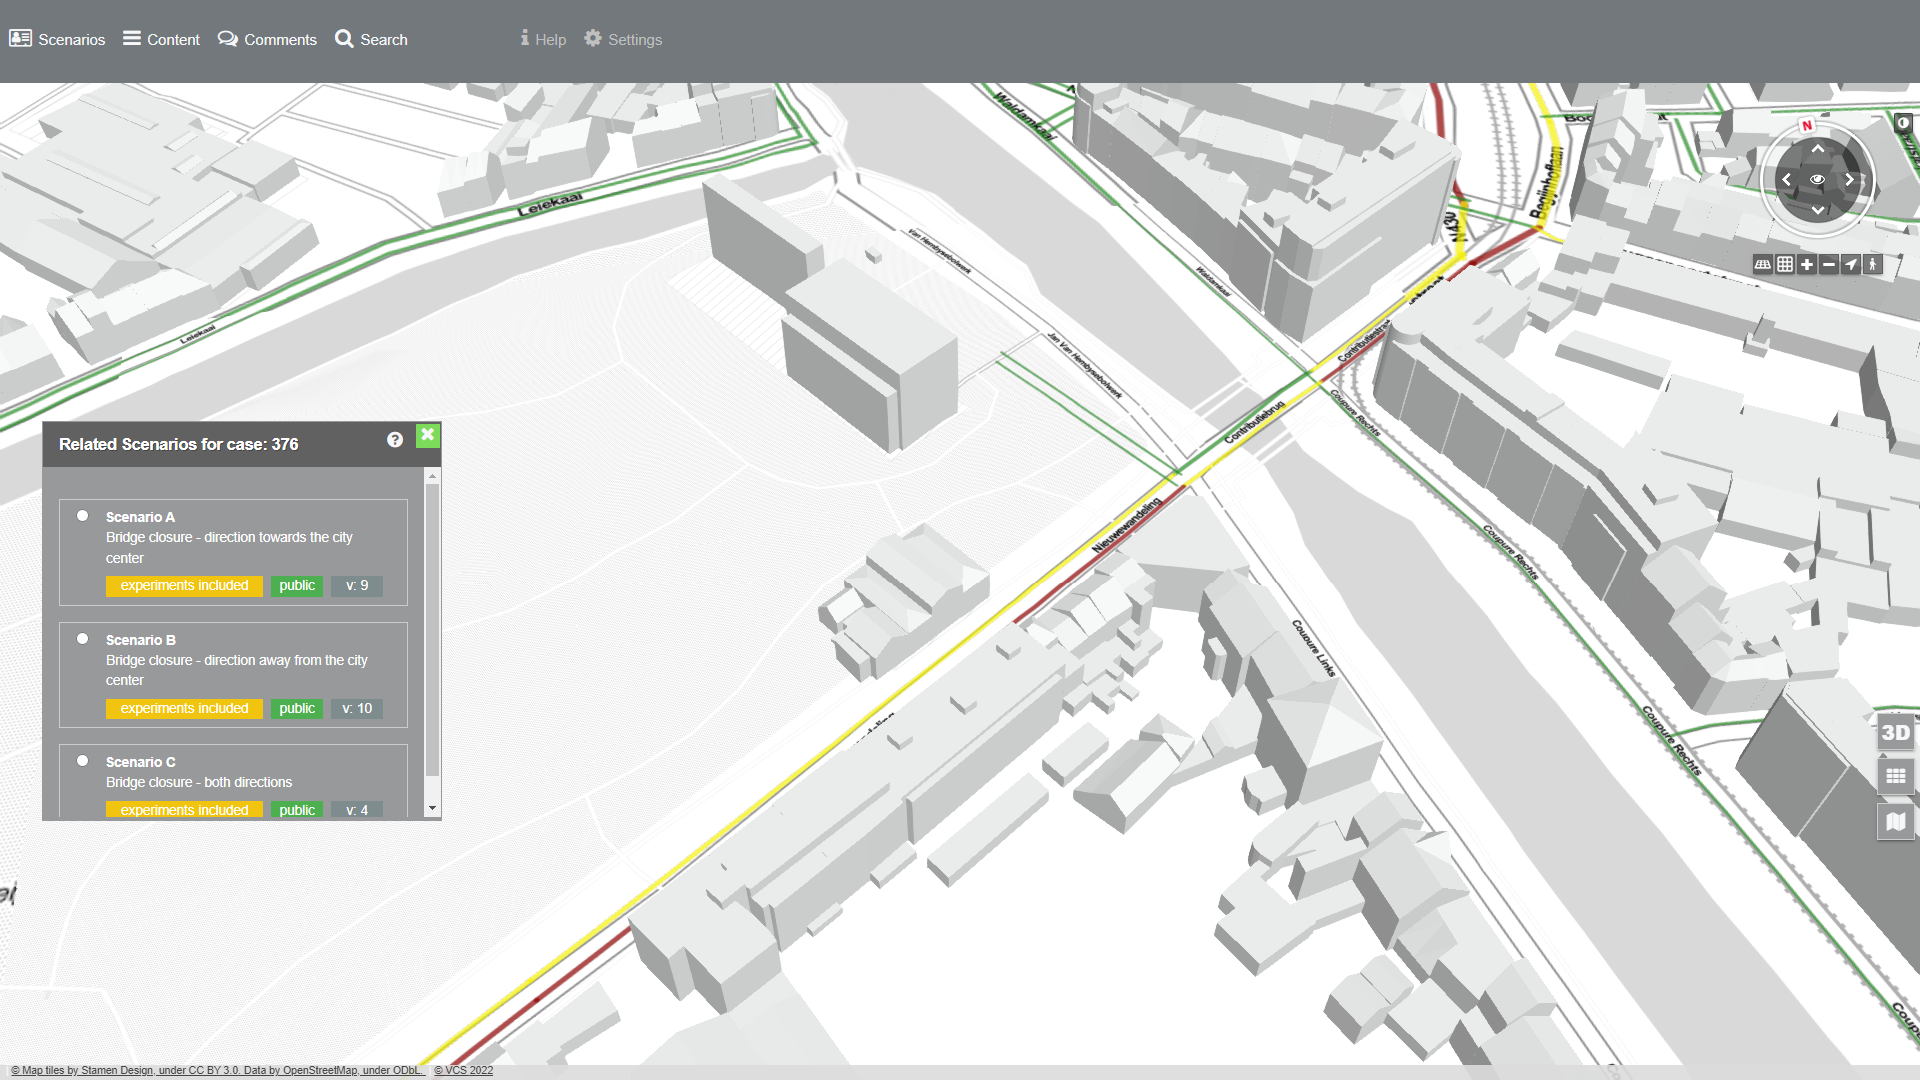
Create / load an experiment
An experiment belongs to a parent case. An experiment is independent from a specific model or simulation. It simply holds the result(s) of model runs. Either as a package - including multiple results from different model runs based on the same change of a road segment(s) or as a single pointer to exactly one model result based on a change of a road segment or multiple segments.
The basic idea of having experiments in DUET is - to be able to persistently store the results of a model run to be reused / reviewed to a later point in time. Thus, once a user is convinced about the results of his model run (simulation scneario) he is able to save either a specific result or all results (package) belonging to the same model run (identifier here is the scenario id).
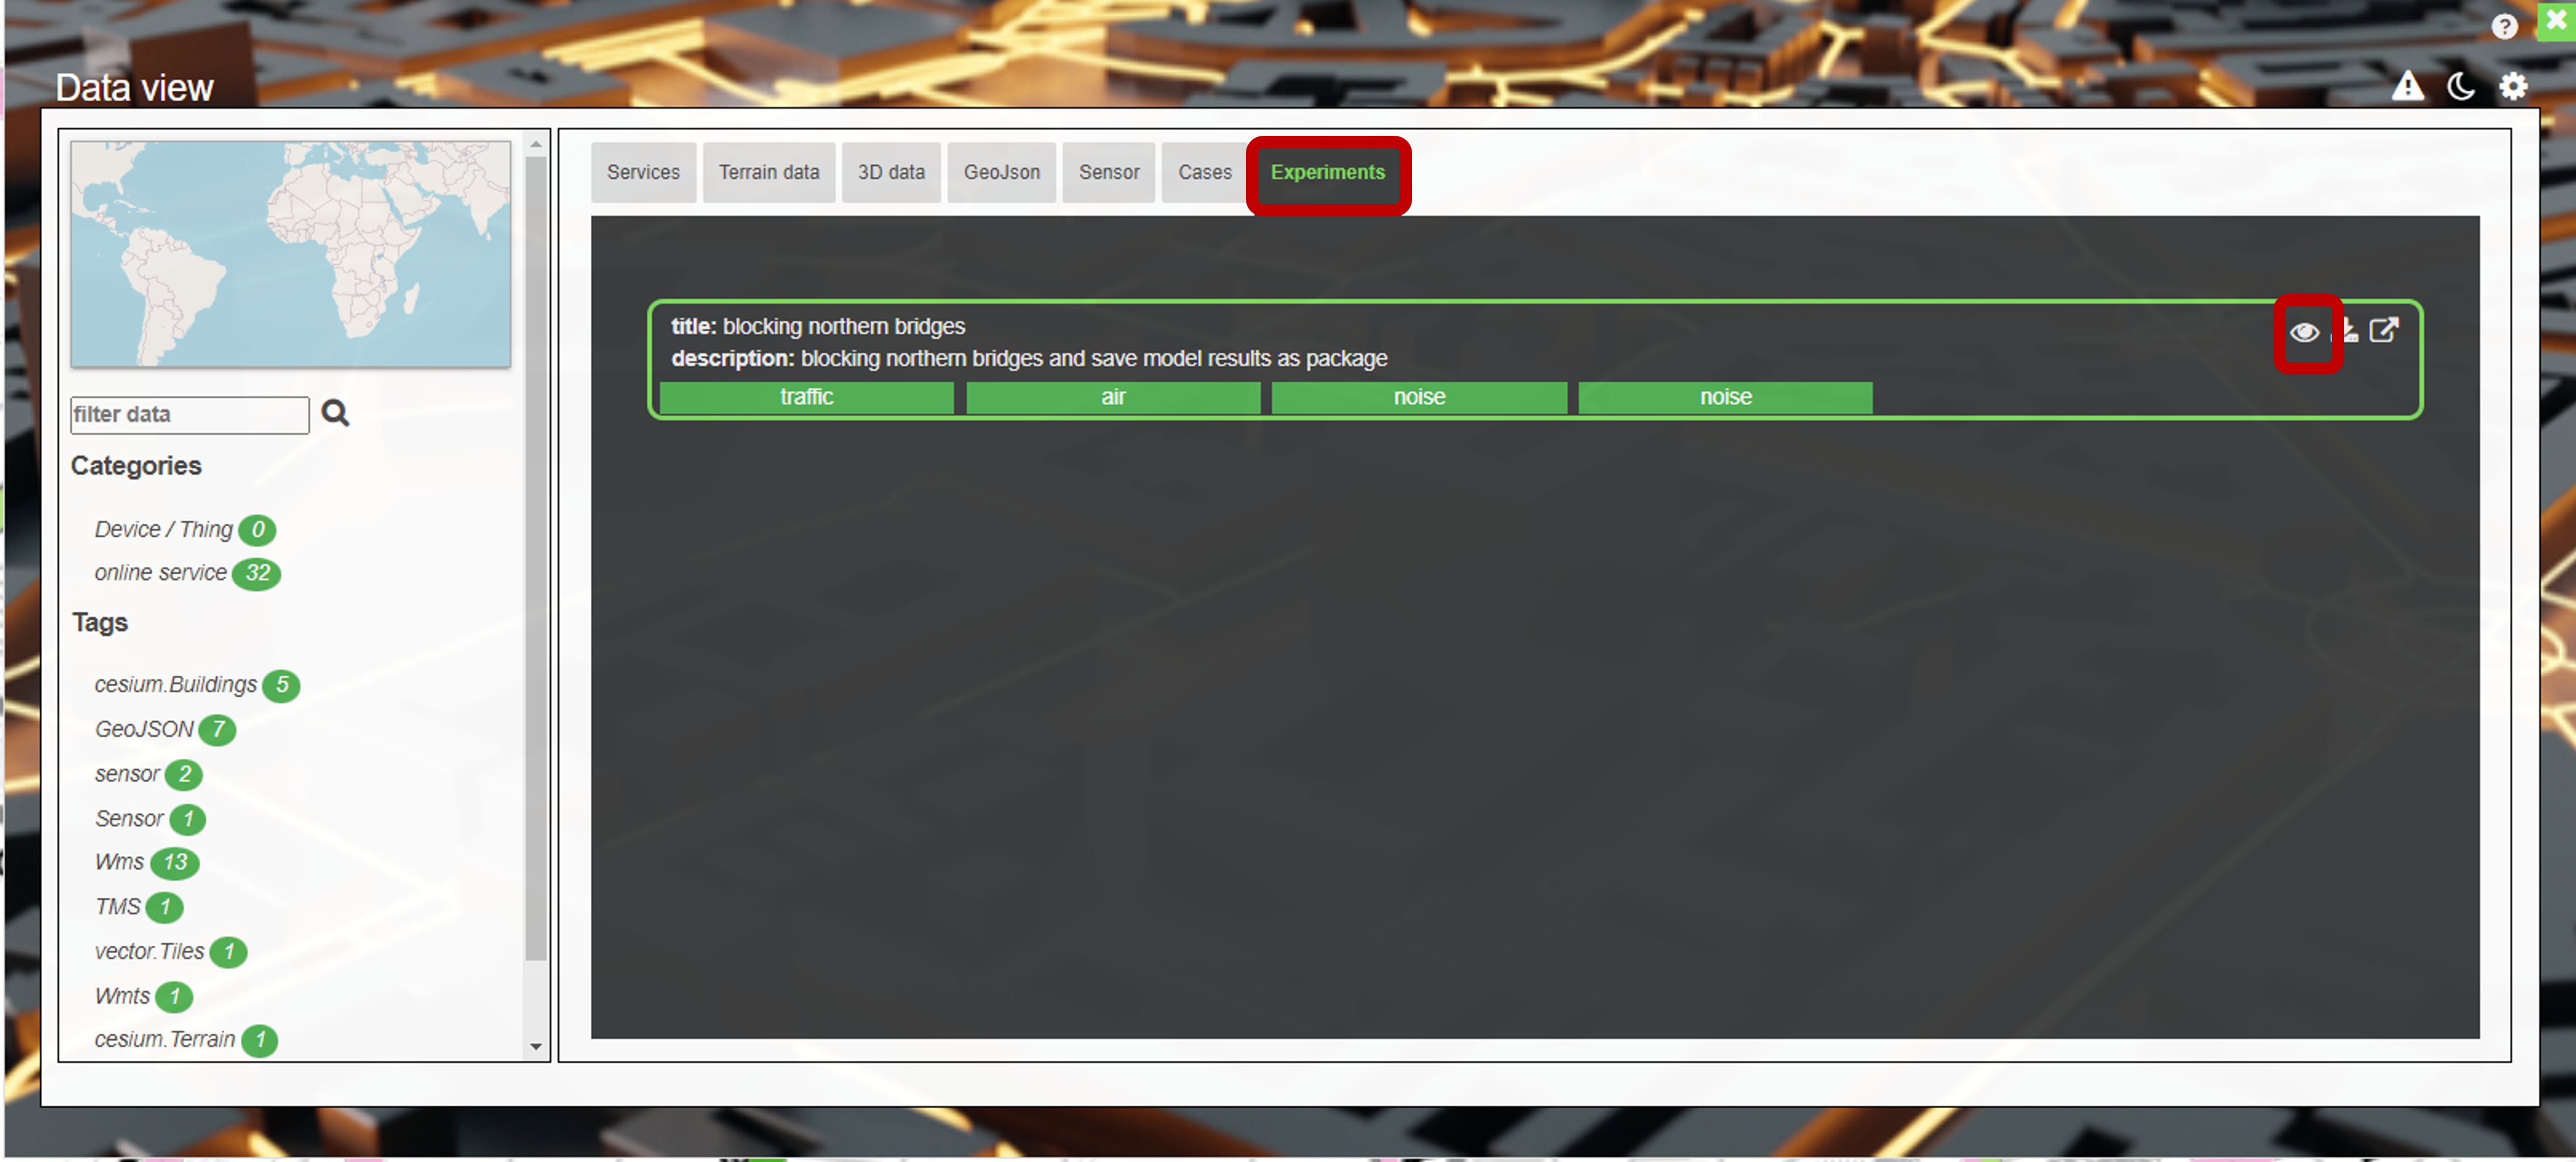
Once the experiment is saved in DUET’S backend, the user is able to load the experiment everytime the resprective parent case is loaded in the viewer. Thus such experiment can be assigned to a new scenario or to an existing scenario of the case by simply using the update method. An experiment can be loaded via the experiments tab, that appears if an experiment is related to a case or scenario, as shown below. Via the eye icon (marked in red ) a user can load and unload an experiment from view.
|
Unregistered users cannot load experiments directly. They can only view experiments via a case loaded into the viewer or via the scenario selector coming along with a loaded case (if and only if scenarios exist for that DUET case) |
Starting an analysis aka simulation
Simulations or Analysis can be triggered by registered users, by selecting one or more road segment(s) in the viewer. Thus some requirements have to be fulfilled:
-
user must be a registered user, and
-
A street network layer for Athens is part of the view, or
-
A street network layer for Pilsen is part of the view, or
-
A street network layer for Gent is part of the view,
A how-to video can be found here: Run an analysis and automatic delta creation.
Once one ot the aforementioned layers is loaded into the view, a user is able to perform an analysis by clicking the Analysis - button in the header line of DUET’s viewer. Users are able to:
-
block multiple roads at once (setting capacity of the respective road segments to 0!)
-
reducing the speed of multiple road segments by percent
-
reducing the capacity of multiple road segments by percent
-
increase the speed of multiple road segments by percent
-
increase the capacity of multiple road segments by percent
A new dialog will appear enforcing the user to select road segments from view, as show in the video as well. The selected road segments will appear in purple. A user will be able to add and remove road segments to the current selection set, before sending them to the model for performing the analysis. By hovering over the items listed in the dialog, the hovered items will be highlighted in red in the viewer. If the user wants to remove a road segment from selection set - a click on the recycle bin will remove the segment.
A how-to video can be found here: adding / removing of road segments from selection set.
Simulation options
DUET offers several simulation options for users in order to give as much flexibility as possible.
| option | sub option | description |
|---|---|---|
block road |
will block all selected road segments completely |
|
change traffic flow by |
capacity |
will change the capacity of all selected road segments by a percentage value, where a percentage value < 100 means a decrease of the capacity and a value > 100 means an increase of the capacity. Thus, a partial blockage of the selected road segments can be simulated as well as increasing the capacity by adding e.g. one or more lanes on the selected road segments. |
change traffic flow by |
speed |
will change the speed of all selected road segments by a percentage value, where a percentage value < 100 means a decrease of the speed and a value > 100 means an increase of the speed. Thus, for example converting streets into tempo 30 zones can be simulated or converting streets into fast lanes can be simulated. |
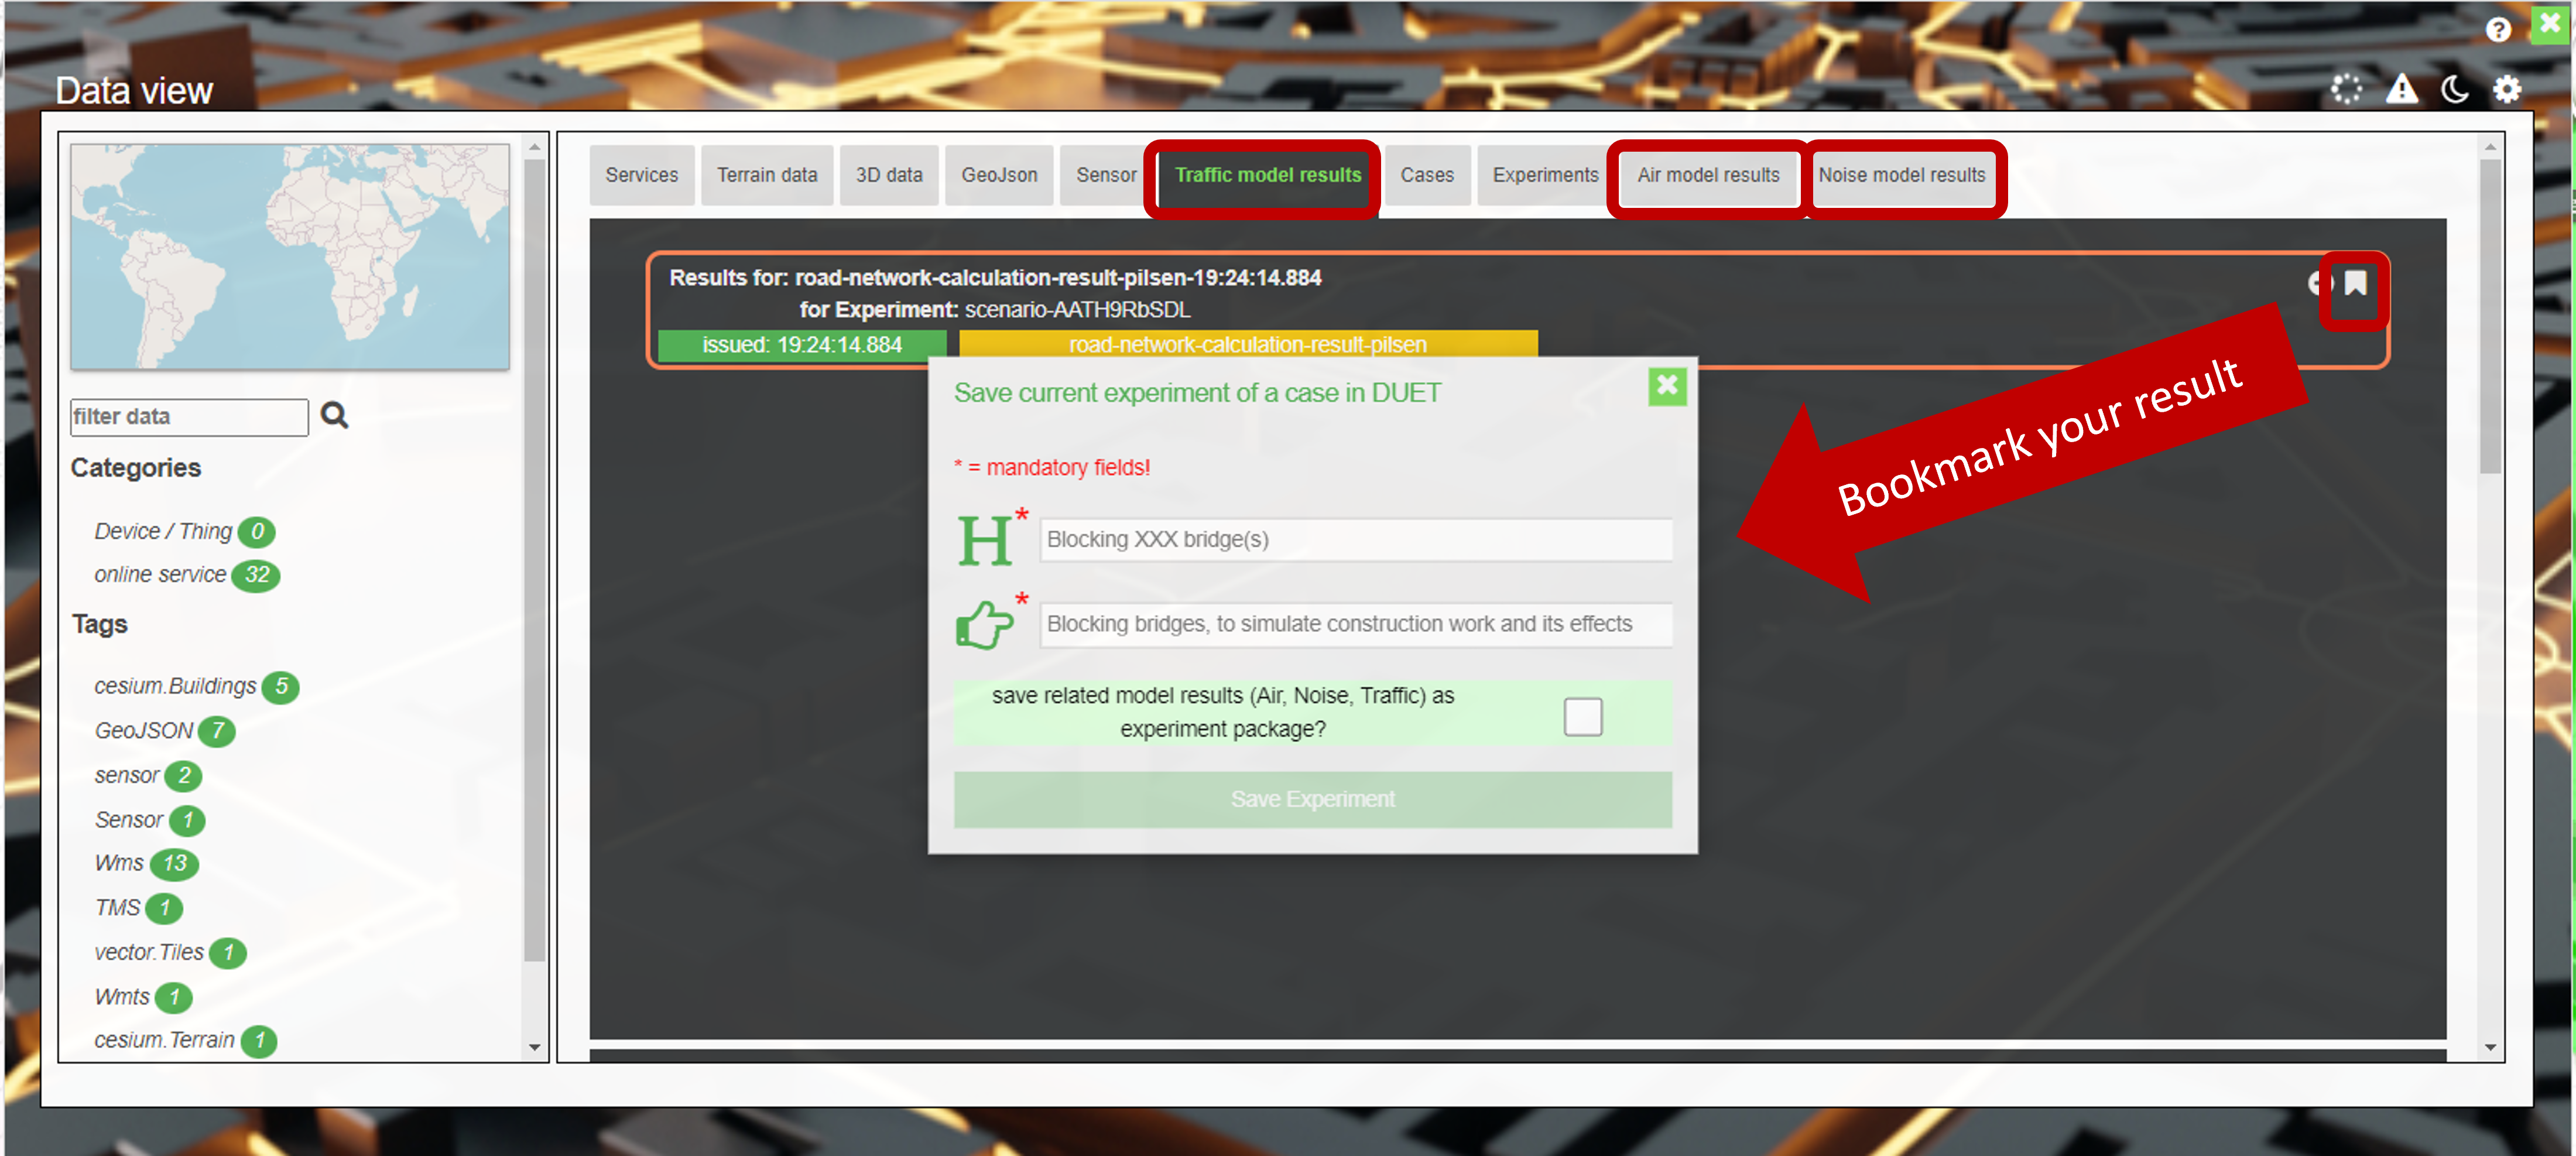
After sending the changes a notification pops up stating that a calculation process is running. A new UI component is integrated into the data view showing pending processes based on the changes the user made. When the traffic model run was successful other models are triggered to run - based on the result of the traffic model run. Thus after the traffic result is available, the pending process dialog shows more processes, usually Air and noise model runs. See the image to the left.
Once the traffic model run is completed, the result is displayed in the “Traffic model results” tab. Here all results are listed for each traffic model run. A new symbol representing a bookmark is integrated into each result list element. A click on it opens a new dialog giving the user the possibility to bookmark or save the model result persistently in Duet environment as part of the case. If a user does not bookmark the results, such results will be discarded from view on a browser refresh or reloading the case. To avoid that, a user can bookmark the model result and thus make it persistent in DUET. More info here: Create / load an experiment
Delta creation & visualisation
Since not every model is able to provide the model results as a service to the visualisation client and thus can also not provide a delta visualisation between the base reference layer and the resulting layer. Hence, the visualisation client was enforced to create the delta layers for these models. A delta layer can be created manually by the user (directly after adding the result into the view), or automatically by the client.
This can be done by any user independent from its role in DUET. Even if a GUEST user is not able to enforce a simulation directly, once a case or scenario has included experiments a user is able to create a delta layer if and only if a base reference layer or another result layer is available.
A delta layer will be visualised in colour blind people friendly colours. Means the pinkish colour palette depicts increases whereas the greenish colour palette depicts the decreases.
At the moment there is no way to store the results of a delta layer creation in DUET. The only way is to enforce the client to do the delta creation all the time an experiment is loaded either using the automated or manual way.
Manually delta creation process
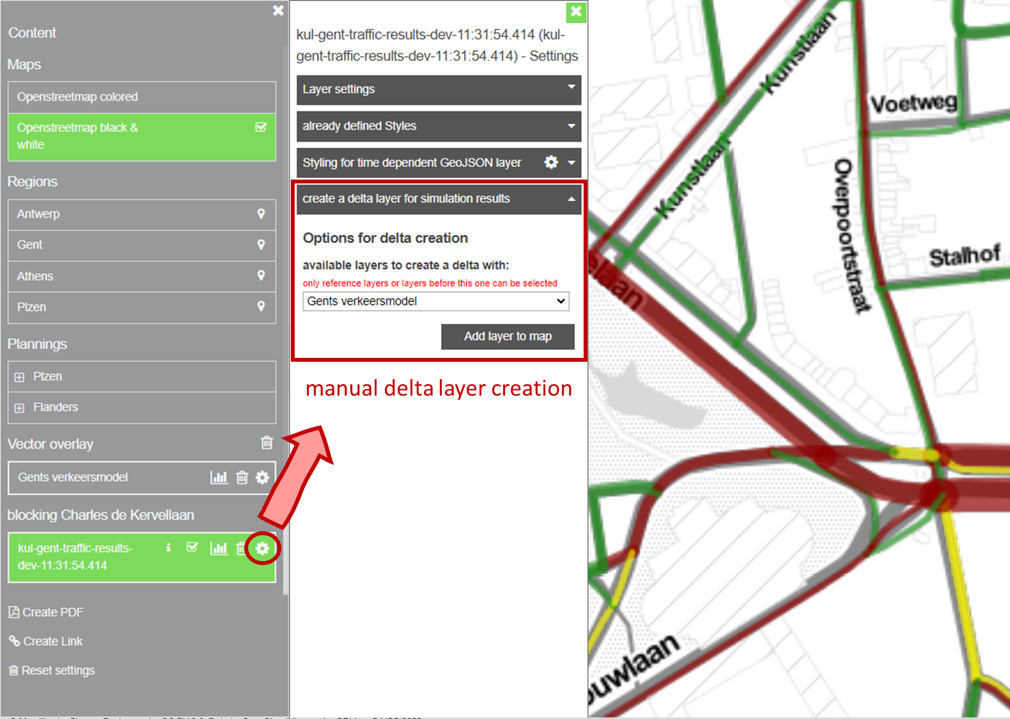
A how-to video can be found here: Manual delta creation.
Automatic delta creation setup
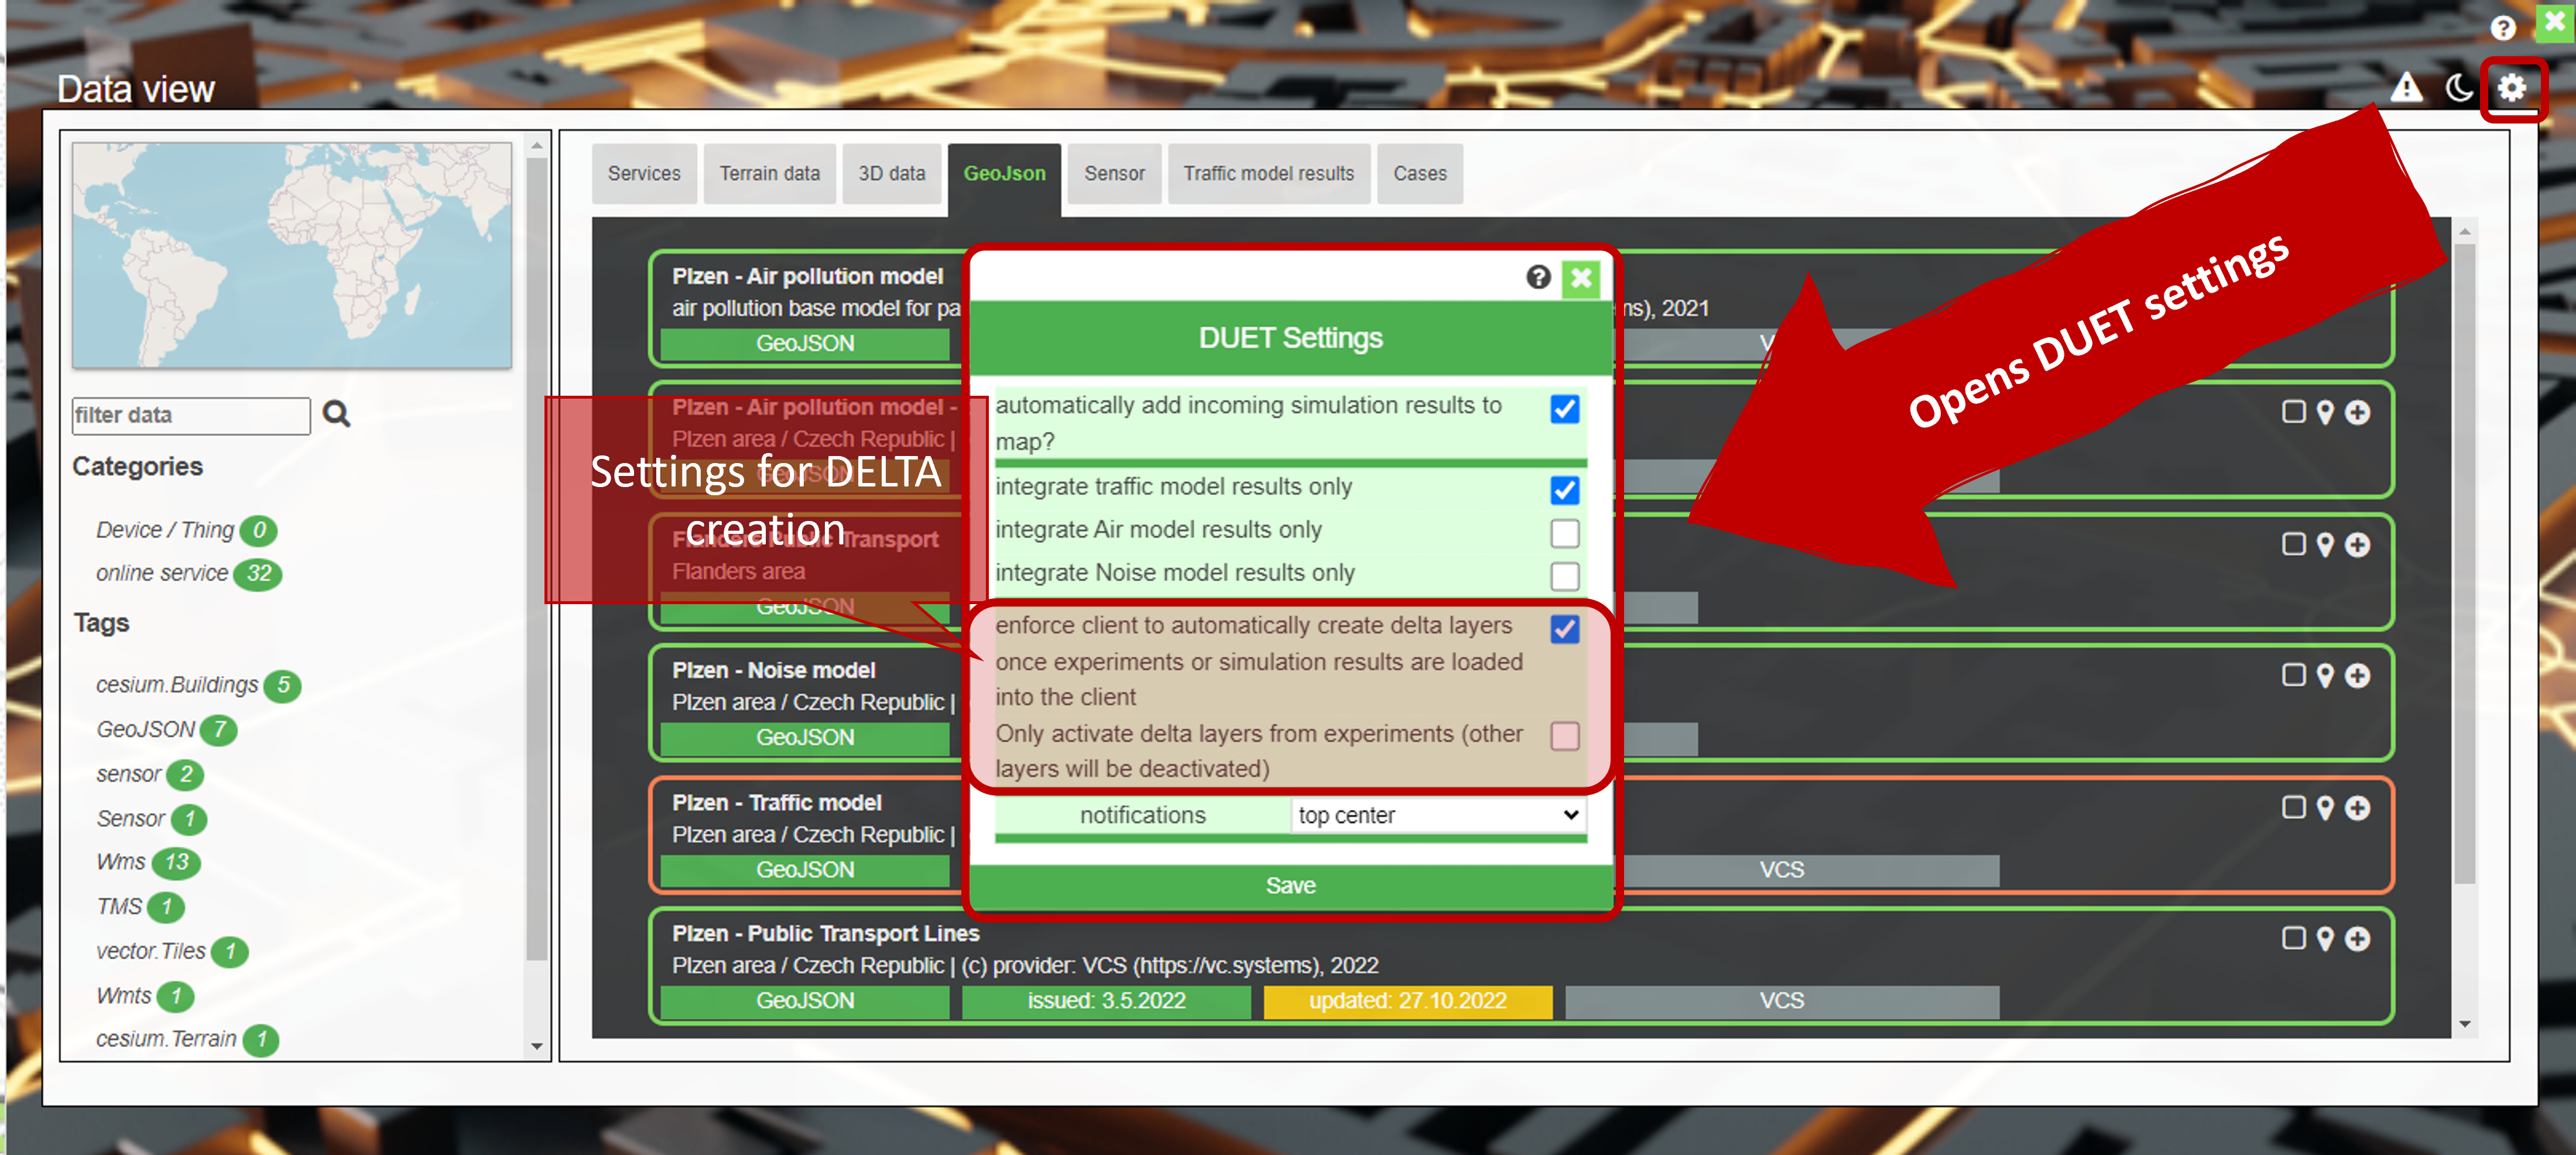
The settings for automatic delta creation and adding can be set in two different places.
The second option for delta layer creation is given for roles with privileges (NON-GUESTS). Those are able to create cases, scenarios, experiments and are able to trigger simulation runs and thus are able to define in a case or scenario that the client should be enforced to automatically create delta layers on case or scenario loading. Means the client automatically fetches the base reference layer of the experiment once an experiment will be loaded and calculates the delta for each feature and each feature attribute being shared by both datasets. The deltas will be then applied to the base reference layer and integrated into the viewer as a delta layer relating to that experiment.
A how-to video can be found here: Settings for delta creation & here: Run an analysis and automatic delta creation.
Delta creation can be defined within a case / scenario as shown in above image or by going into the settings tab and adjusting the settings for delta creation there, as shown below.
DUET videos
Introduction videos
Demo videos
How-to videos
|
FOR REGISTERED USERS ONLY! |
Generics
Delta creation
Dealing with Experiments
VC MAP
The Visualisation client based on VC Map (provided by VCS) can be used from any computer or workstation with a modern browser which enables the execution of JavaScript and WebGL. WebGL is an API for rendering 3D computer graphics within a browser without the use of plug-ins. It has been activated in all modern browsers since 2011. Internet Explorer is not supported anymore. Microsoft Edge supports WebGL from version 0.95.
VC Map is a JavaScript framework and API for building dynamic and interactive maps on the web. It can display 2D data, oblique imagery and massive 3D data including terrain data, vector data, mesh models, and point clouds making it easy for users to explore and interact with the data in an integrated and high-performance map application. VC Map apps can be rendered in all modern web browsers and on both desktop and mobile devices, bringing the map to where the user is. VC Map is built upon open, proven, and reliable GIS and web technologies such as OpenLayers and Cesium for the visualisation of 2D and 3D geo-data. It can load and display data from various sources and in different formats including open OGC standards and interfaces. Users can easily switch between the 2D, oblique and 3D views and dynamically add map layers to the scene that are accessible in all views. The VC Map framework offers ready-to-use map tools and widgets that can be flexibly combined in a VC Map app to meet the needs and demands of end-users and the target audience. Examples are navigation controls, map layers and legends, drawing and editing tools, split screens, camera flights, and GIS tools such as measurements, height profiles, viewshed analysis, or real-time shadows. VC Map provides a strong programming API for developers that makes it easy to build customised VC Map applications, to integrate VC Maps into any web page and to extend its functionalities with its own plugins. The VC Map framework and API is structured into the following four main architectural layers:
DUET’s visualisation client is developed as Plugin for VC Map using the above mentioned Plugin API. Thus the existing visualisation client is bound to the provided VC Map version.
General Information
The shown application is based on the virtualcityMAP technology of virtualcitySYSTEMS. It contains, depending on the configuration, an integrated viewer for oblique images, 2D maps and 3D maps. In case of any questions do not hesitate to contact your contact person at virtualcitySYSTEMS.
System Requirements
The virtualcityMAP can be used from any computer or workstation with a modern browser which enables the execution of JavaScript and WebGL. WebGL is an API for rendering 3D computer graphics within a browser without the use of plug-ins. It is activated in all modern browsers since 2011. Internet Explorer supports WebGL from version 11. In order to activate WebGL in older version of the Internet Explorer please use the IEWebGL-Plug-in. Microsoft Edge supports WebGL from version 0.95.
There is an official website to test if your browser supports WebGL: http://get.webgl.org.
Wikipedia provides a list of supporting browsers: https://en.wikipedia.org/wiki/WebGL.
User Interface
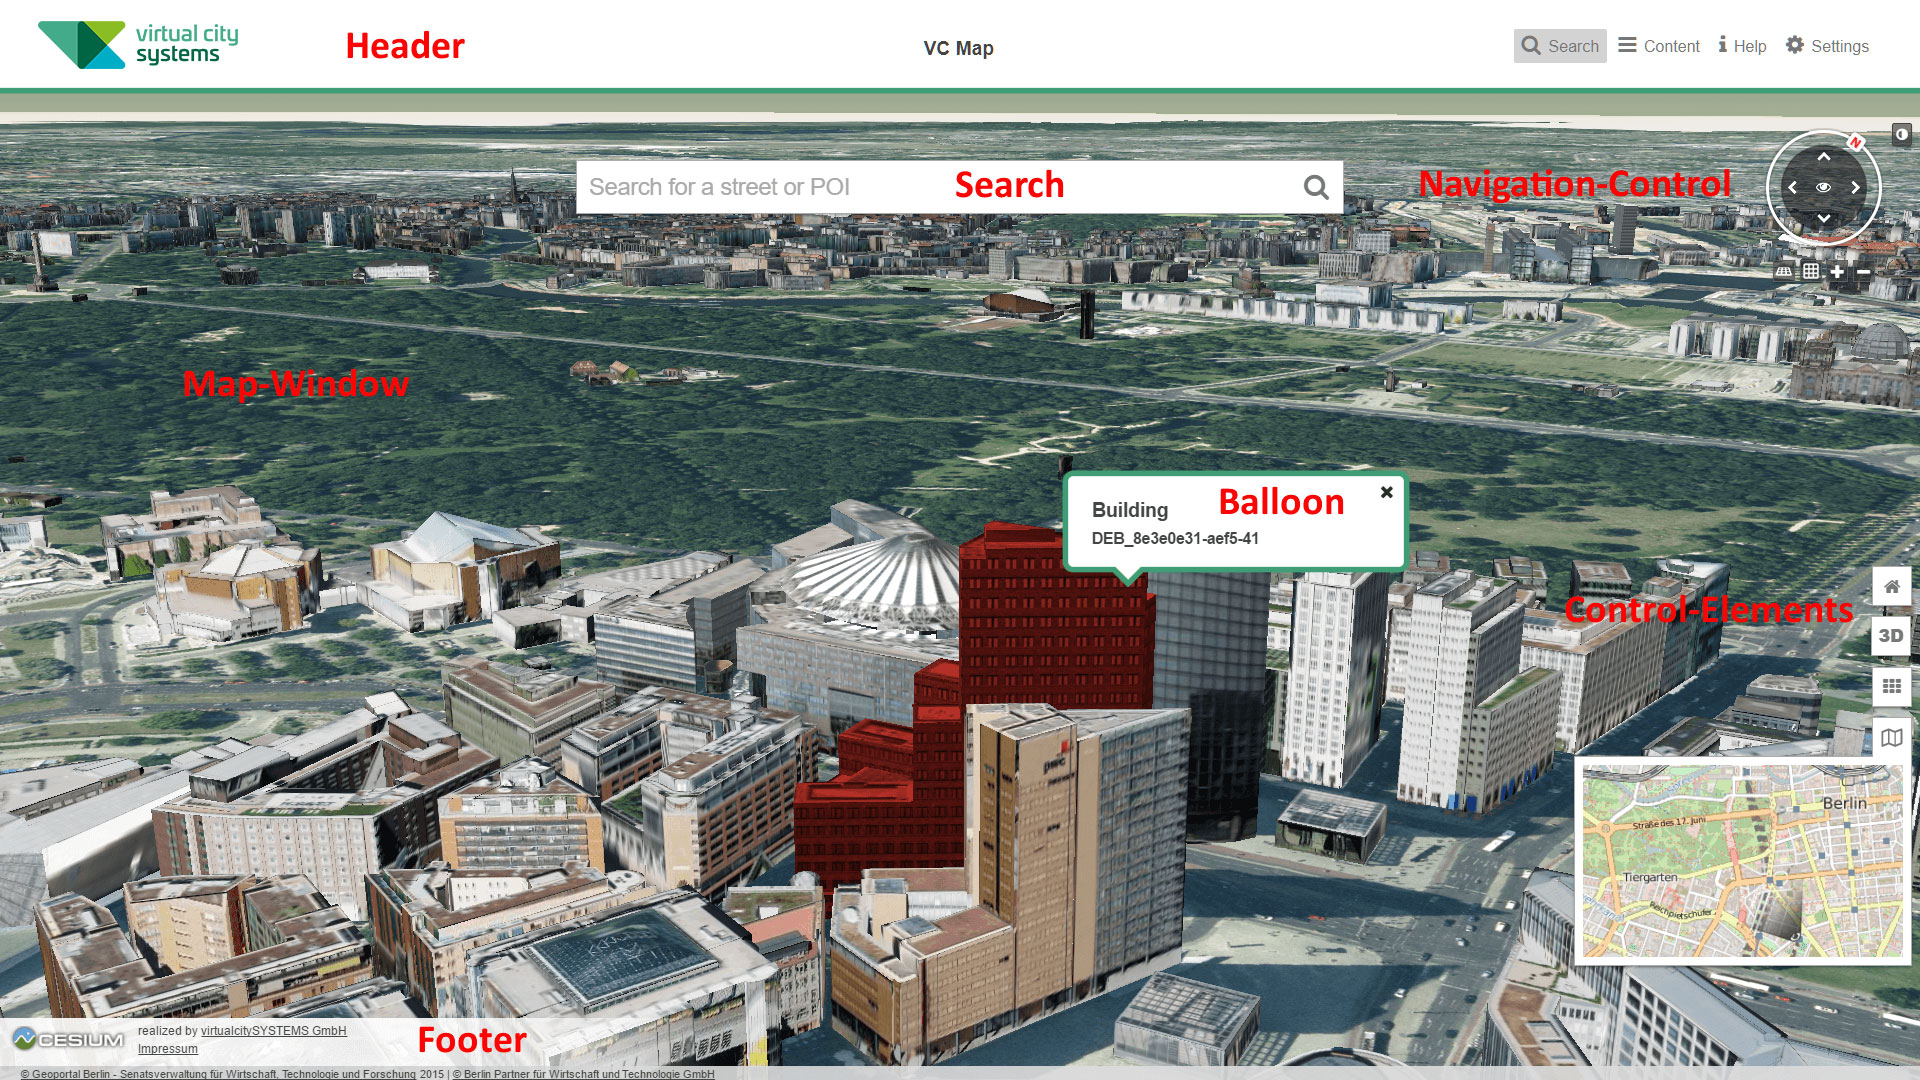
In the map-window of the application next to the search bar there is the navigation-control as well as the vertical control-elements.
Navigation-Control
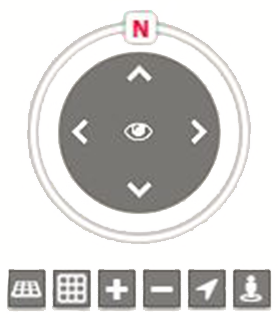
By clicking the arrows in the navigation control it is possible to navigate to the corresponding direction via mouse click. By clicking the N-symbol the map is oriented towards north. When clicking the eye-symbol the map starts to rotate around the current view. When clicking the eye-symbol again the rotation will be stopped. This function is available in the 3D map only. The horizontal control elements, located below the navigation control, allow to tilt the view as well as to zoom in and out.
Pedestrian Mode
Explore the city model in pedestrian mode by first selecting the figure and then placing it in the map. You can then use the arrow keys on the keyboard to simulate steps forward, back, left and right. By holding down the right mouse button, you can rotate the figure in the desired direction. Thus, a free movement on the terrain is obtained. The control panel in the pedestrian mode also allows you to adjust the viewing angle and the height of the view over the terrain. To end the pedestrian mode, click on the figure again to deselect it.
Control-Elements
The control elements in the right handed vertical pane provide additional functionality.
By clicking the ![]() home-button the application returns to the start view-point.
By clicking one of the
home-button the application returns to the start view-point.
By clicking one of the  the user can switch between the 2D-, 3D-, and oblique-view.
If certain widgets (export, query, etc) are configured for this virtualcityMAP, those can be activated by clicking the functions-icon with the raster symbol
the user can switch between the 2D-, 3D-, and oblique-view.
If certain widgets (export, query, etc) are configured for this virtualcityMAP, those can be activated by clicking the functions-icon with the raster symbol ![]() . The available widgets are explained separately.
A click on the map-symbol
. The available widgets are explained separately.
A click on the map-symbol ![]() opens the 2D overview map. The overview map shows the current view in a larger area. In addition, the position of the camera is visualized. Thus, this widget facilitates an easier orientation in the map. If the overview-map is activated in the oblique view, the oblique images' outer rings are visualized in the overview-map additionally.
opens the 2D overview map. The overview map shows the current view in a larger area. In addition, the position of the camera is visualized. Thus, this widget facilitates an easier orientation in the map. If the overview-map is activated in the oblique view, the oblique images' outer rings are visualized in the overview-map additionally.
Selection of Objects
A single building can be selected by a left-click. It will be colored by default in red, but the color may differ from red, depending on specific settings by the map owner. If there are additional information available for this building, those will be provided in an information-balloon. A click on an empty region (e.g. the terrain) deselects the building. Multiple objects can be selected by using the combination Ctrl+Click. The selected objects will be highlighted by default in blue, but can vary due to configuration. owever usually the multi selection color differs from single selection color. This function may be used to highlight certain buildings. It is used by the export widget, too. If multiple buildings are selected, they need to be deselected individually.
The footer contains the imprint as well as the data protection notice. Some applications may provide the coordinates of a clicked positions in the footer. In the oblique view the footer contains the name of the current oblique images. Additionally, the footer may contain copyright statements for certain layers.
2D Map View
The 2D-map view provides the following navigation options:
Navigation in the map:
| .. by mouse | … by keyboard | |
|---|---|---|
Map pan |
Left mouse click and pull map |
Press arrow keys to navigate to the corresponding direction |
Zoom in / Zoom out |
Zoom in or out by spinning the mouse wheel |
Press plus or minus key |
3D Map View
The 3D-map view visualizes a terrain based on the open-source technology Cesium. The same terrain texture is used as in the 2D view. If there are additional layers, these can be activated in the filter menu.
Navigation in the map:
| .. by mouse | … by keyboard | |
|---|---|---|
Map pan |
Left mouse click and pull map |
Press arrow keys to navigate to the corresponding direction |
Tilt view |
Press mouse wheel and move mouse front or back Press 'Page Up' resp. |
'Page Down' key |
Rotate view |
Press mouse wheel and move mouse to the left or right |
Press 'Home' resp. 'End' key |
Zoom in / Zoom out |
Zoom in or out by spinning the mouse wheel |
Press plus or minus key |
Settings
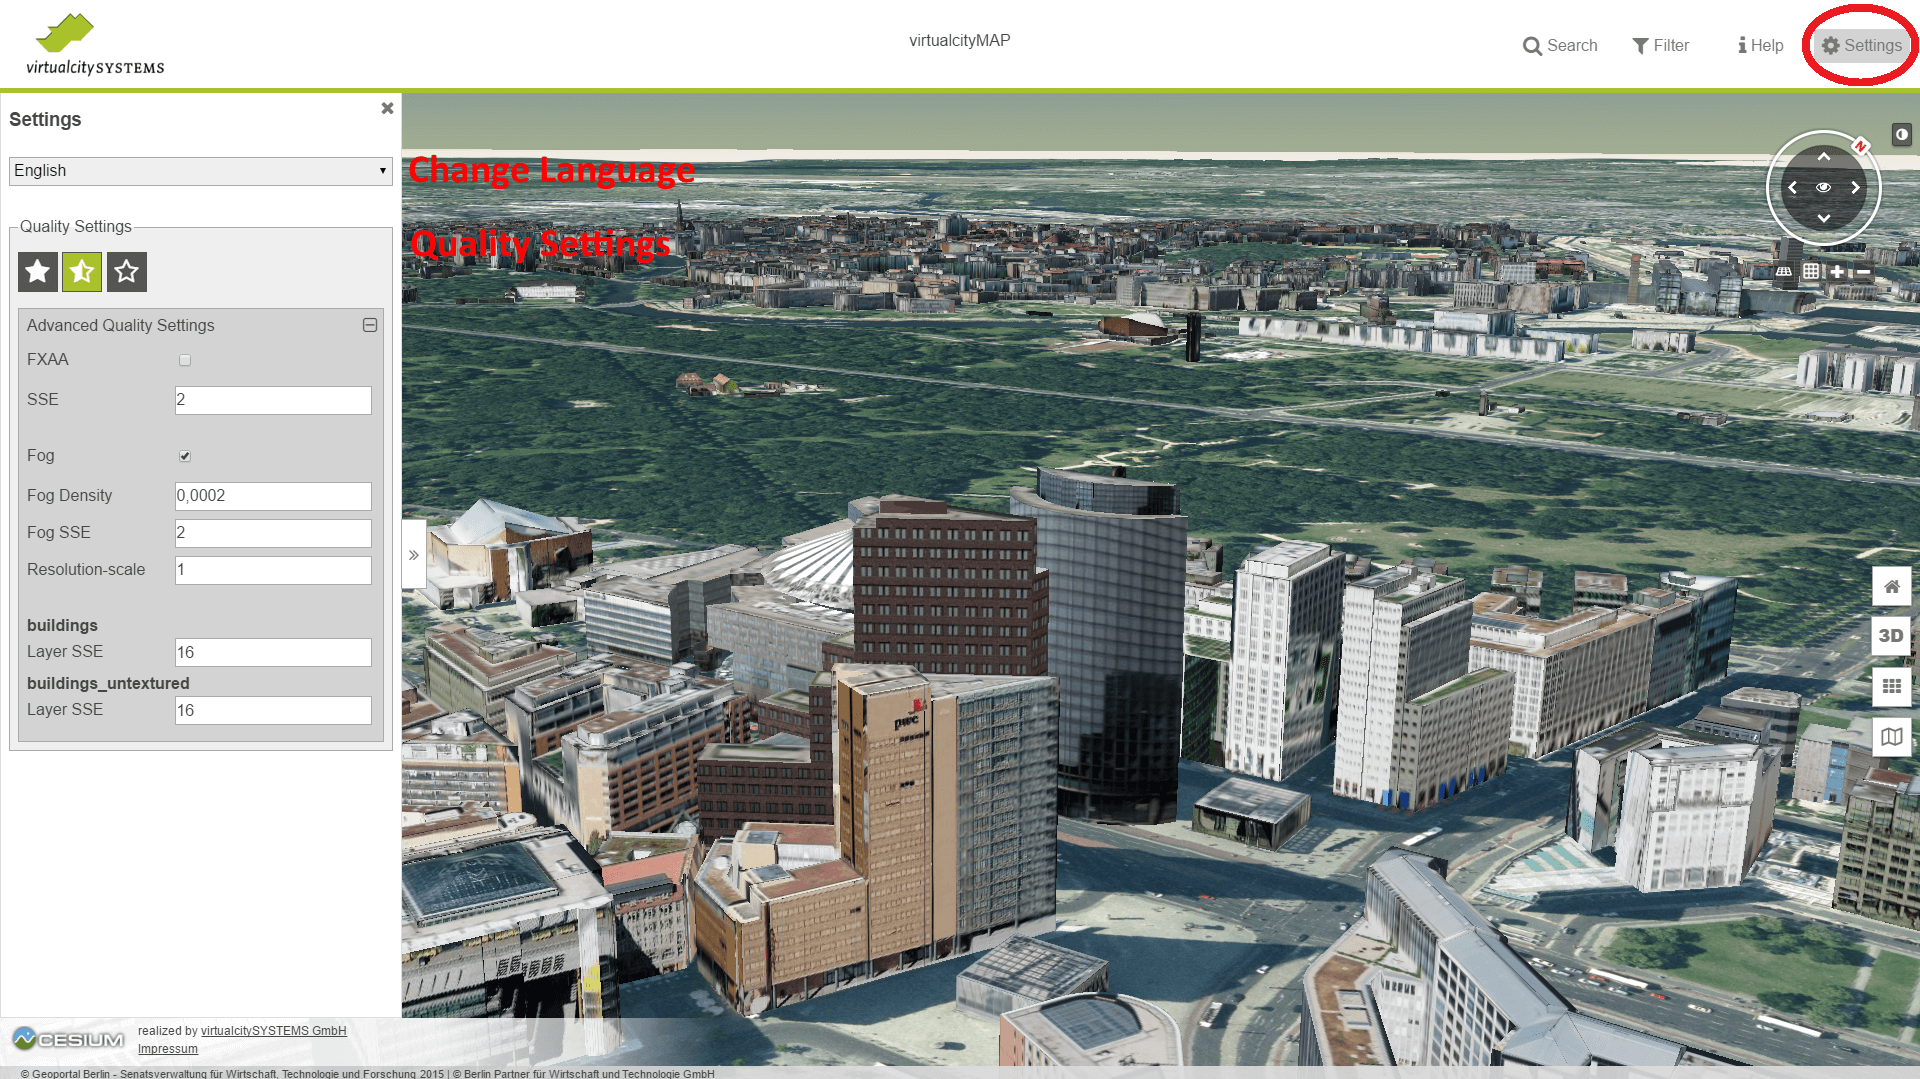
A click on the 'Settings' icon in the header of the application opens up a settings menu. It allows to change the settings of the virtualcityMAP.
Language Setting
The selection of a language from the drop-down menu changes the application’s language.
Quality Settings
If the Display Quality Widget was added to the virtualcityMAP, the user is able to change the application’s visualization quality. The star-symbols represent predefined quality settings (high, medium, low), which can be activated by a click. If the option 'Advanced Quality Settings' is available, the user is able to specify advanced settings. The dialog provides the following options:
| Option | Description |
|---|---|
FXAA |
Selection if the Fast Approximate Anti-Aliasing algorithm (FXAA) will be used for anti-aliasing. |
SSE |
Defines the Screen Space Error (SSE) factor of the map, which will be multiplied with the map’s SSE value. |
Fog |
Selection if fog shall be used. Fog will reduce sighting distance but enhance performance. |
Fog Density |
Defines the factor which will be multiplied with the map’s fog density value. |
Fog SSE |
Defines the factor which will be multiplied with the fog’s SSE value. |
Resolution-Scale |
Scale factor of the application’s resolution. A value of 1 adopts the resolution of the browser. This correlates to the best quality. A higher value reduces the resolution, e.g. with a value of 2 only 1/4 of pixels will be rendered. |
Layer SSE |
Defines the factor which will be multiplied with the SSE value of the corresponding layer. |
Content
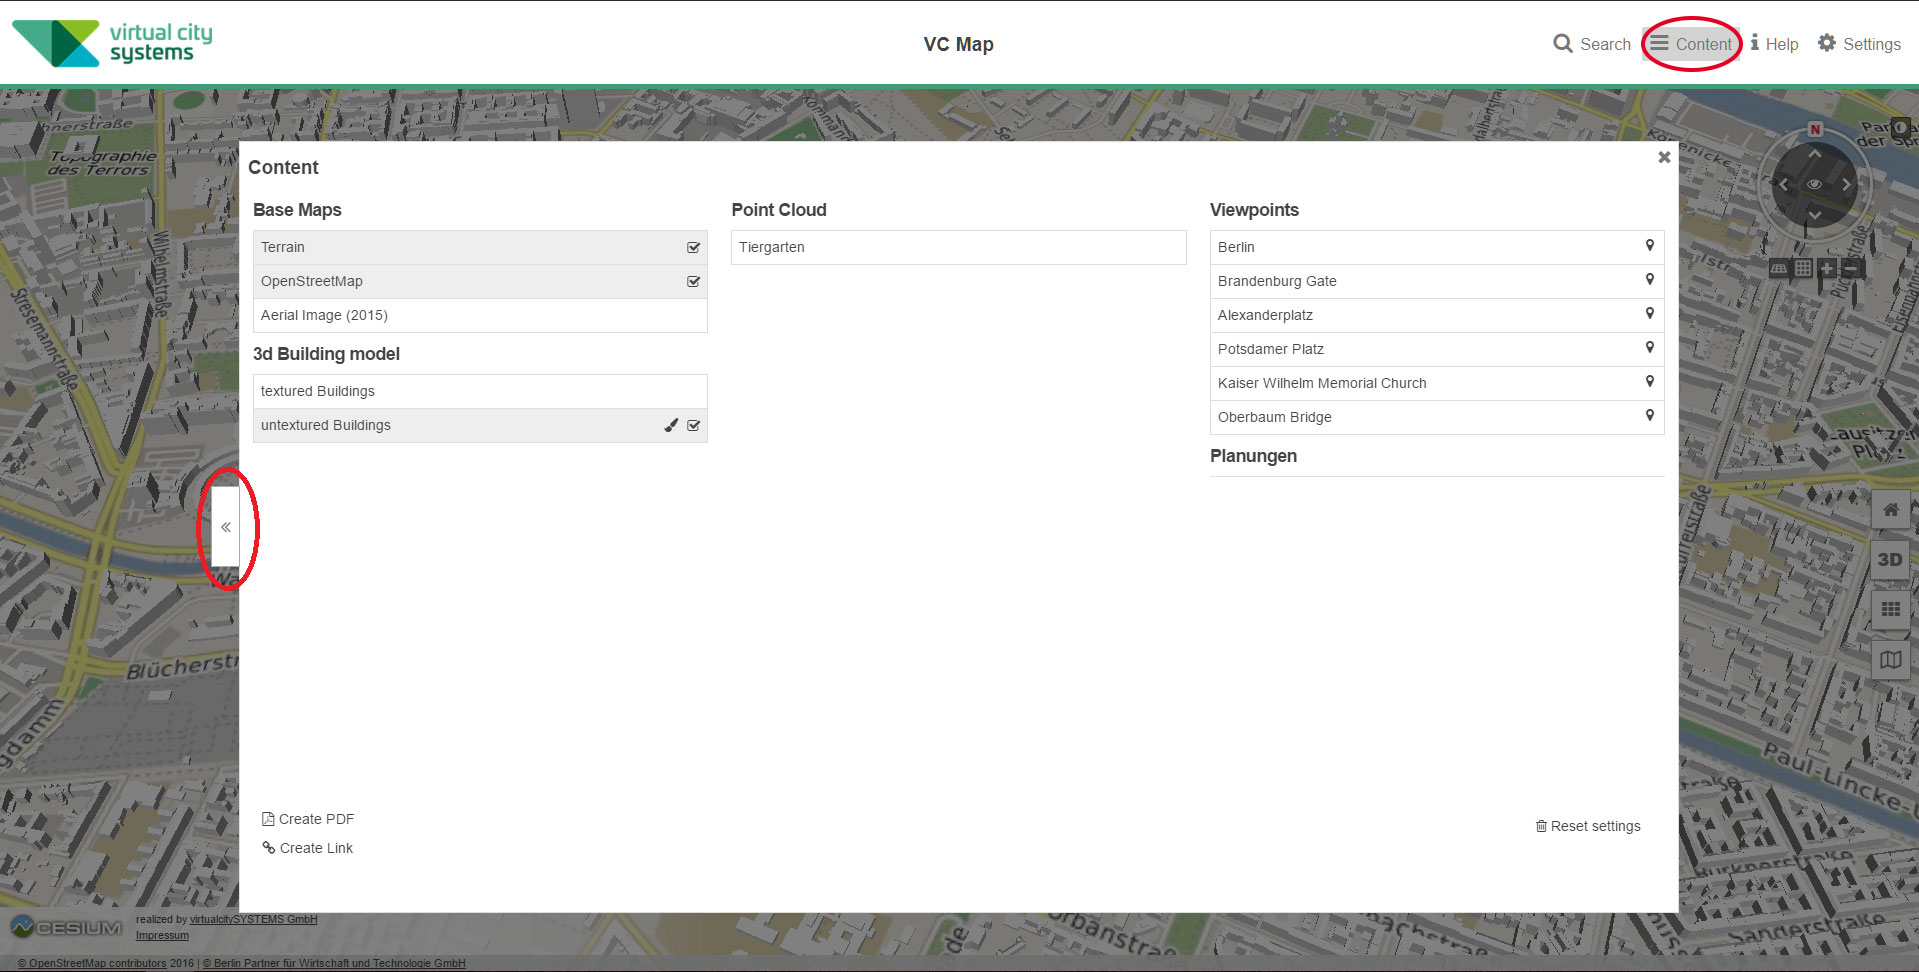
A click on the 'Content' icon in the header of the application opens up a map key with thematically sorted information. The map key allows to activate resp. deactivate layers and predefined view points. Depending on the activated map view (2D, 3D, or oblique) it may be possible to activate resp. deactivate different layers.
The content menu can be moved from the center to left side of the application and vice versa by clicking the arrow symbol. It is possible to navigate in the map only if the content menu is located on the left side of the application.
Additionally, the filter menu provides the following functions:
-
Create PDF
This function allows to save the current map extract with the current markers and information as a PDF file. -
Create Link
This function allows to create a link pointing to the current map extract with the activated layers. A click on the 'copy' symbol left to the link copies the link into the clipboard. -
Reset filter and settings
Resets all changes made in the filter menu.
Search Function
If the search plugin was added to the virtualcityMAP, it gives users the possibility to look for addresses or key words. The search box may support the user by providing suggestions (e.g. key words, company or street names) to complete the query. The search can be found within the applications header.
Shadow
If the shadow widget is available in the virtualcityMAP the following icon appears next to the navigation control: ![]() .
.
A click onto the icon activates the shadow on the map and opens a slider to change the day time. A click on the screw-wrench opens up a menu to select the exact date and daytime of the simulated shadow.
Navigation
The 2D- as well the 3D-view allow to navigate in the map by using the mouse or the keyboard.
2D Map View
The 2D-map view provides the following navigation options:
Navigation in the map:
| .. by mouse | … by keyboard | |
|---|---|---|
Map pan |
Left mouse click and pull map |
Press arrow keys to navigate to the corresponding direction |
Zoom in / Zoom out |
Zoom in or out by spinning the mouse wheel |
Press plus or minus key |
3D Map View
The 3D-map view visualizes a terrain based on the open-source technology Cesium. The same terrain texture is used as in the 2D view. If there are additional layers, these can be activated in the filter menu.
Navigation in the map:
| .. by mouse | … by keyboard | |
|---|---|---|
Map pan |
Left mouse click and pull map |
Press arrow keys to navigate to the corresponding direction |
Tilt view |
Press mouse wheel and move mouse front or back Press 'Page Up' resp. |
'Page Down' key |
Rotate view |
Press mouse wheel and move mouse to the left or right |
Press 'Home' resp. 'End' key |
Zoom in / Zoom out |
Zoom in or out by spinning the mouse wheel |
Press plus or minus key |
Troubleshooting
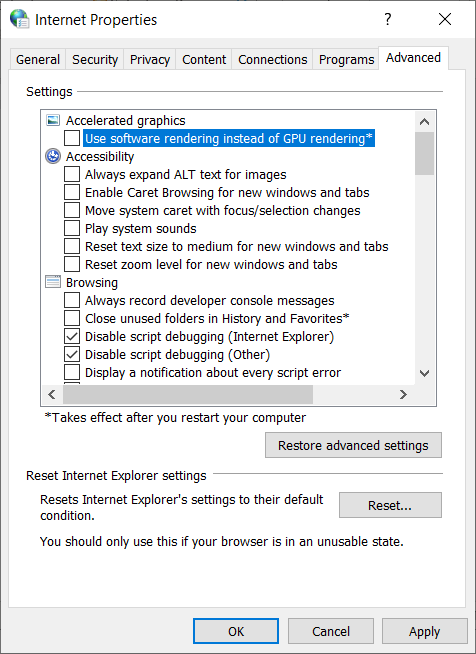
If the 3D map does not load in your browser or runs very slowly: Possible causes
Lack of hardware acceleration
The hardware acceleration of your graphics card is not supported - This means that the web browser has switched to software rendering, so a high-performance display of 3D data is not possible from a purely technical point of view. Suggested solution: You can test the current browser setting regarding hardware or software rendering via the website http://webglreport.com/.
Software rendering is active = 3D map cannot be used with your browser.
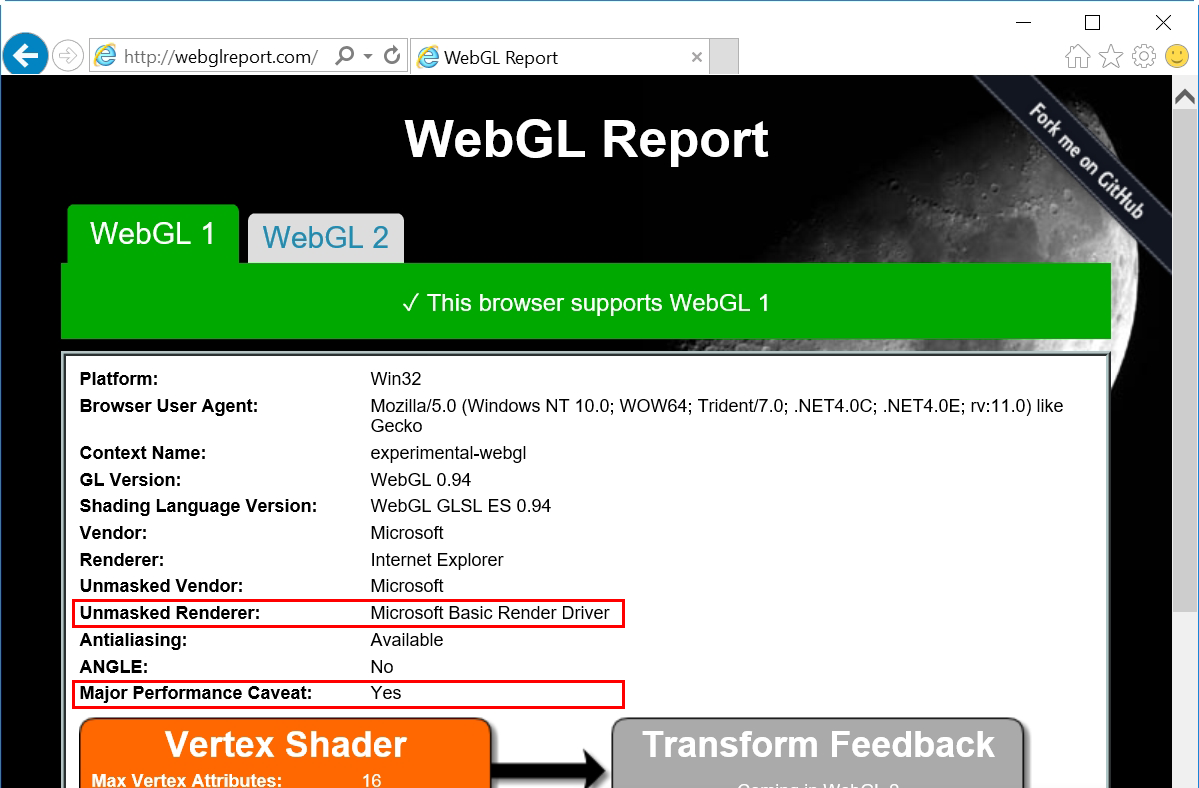
Hardware rendering is active = 3D map can be used with your browser
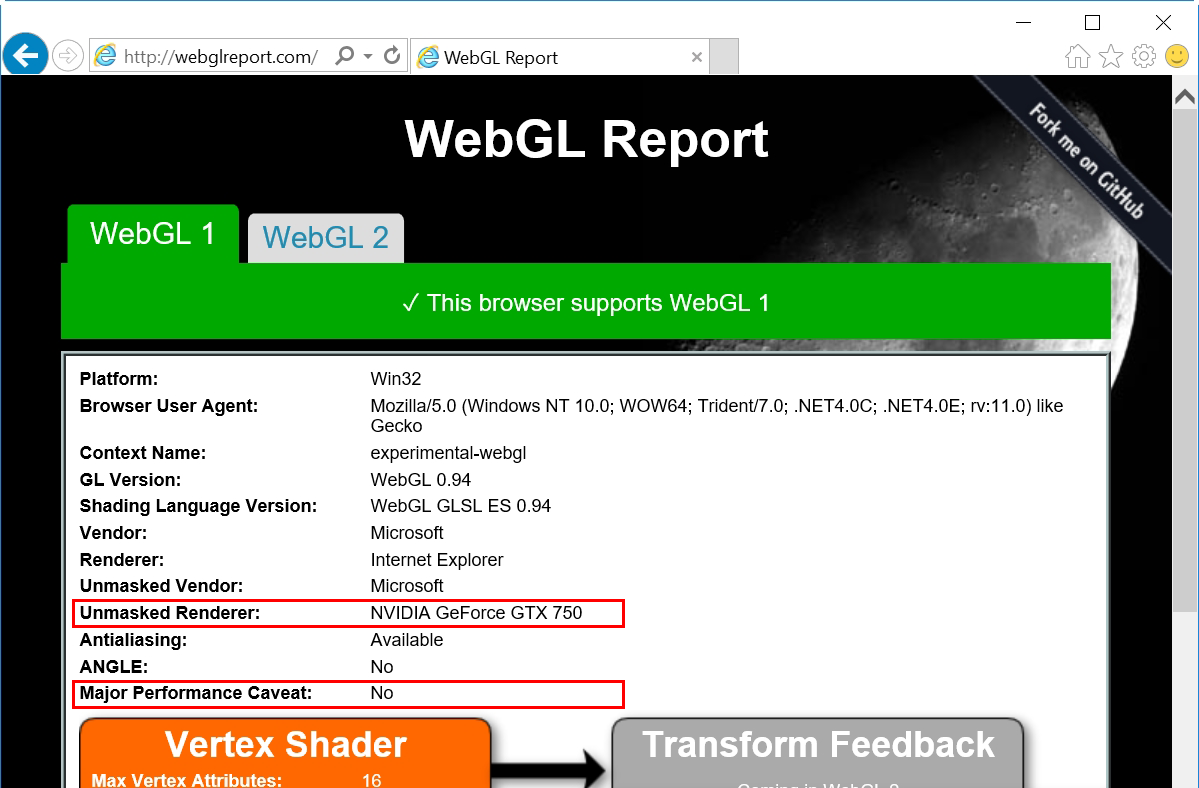
Graphics driver is outdated
Suggested solution: Please update your graphics driver and check if hardware support is enabled.
Your browser does not support WebGL
see suggestion here:
FAQ
I cannot see anything in my browser
Suggested solution: Please use a current browser e.g. Firefox from 51.x , Google Chrome from 56.x , Internet Explorer is NOT supported! Microsoft Edge is WebGL capable from version 0.95.